
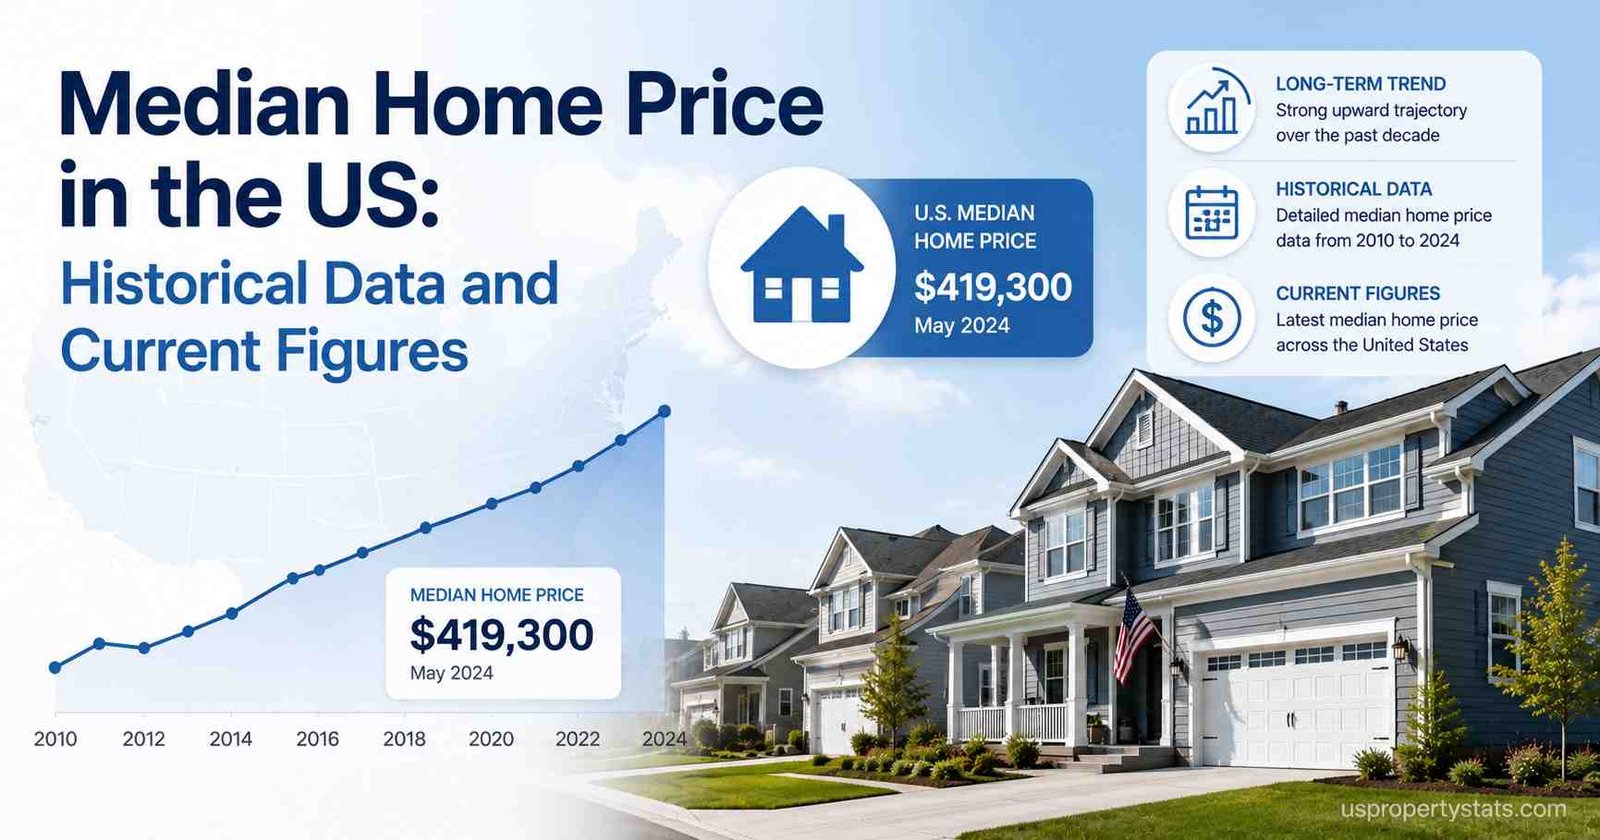
The median home price in the United States was $417,700 for existing homes in April 2026, according to NAR, marking the 34th consecutive month of year-over-year price increases. The US Census Bureau reports the median across all homes sold at $403,200 in Q1 2026, down from the all-time high of $442,600 reached in Q3 2022.
This page presents median home price data across three dimensions: current figures from multiple authoritative sources, a 25-year historical trend from 2000 to 2026, and a state-by-state breakdown ranking all 50 states. All data is sourced from NAR, the US Census Bureau via FRED, and Zillow Research. Updated quarterly.
One critical clarification before the data: “median home price” means different things depending on the source. NAR reports the median price of existing homes sold each month. The Census Bureau reports median prices across all homes sold, including new construction.
Zillow’s Home Value Index estimates the value of all homes, not just those that sold. These three metrics will never match, and understanding the difference is essential to interpreting housing data correctly.
| Source | Metric | Latest Value | Period | YoY Change |
|---|---|---|---|---|
| NAR | Median existing-home sale price | $417,700 | April 2026 | +0.9% |
| Census Bureau (FRED) | Median sale price, all homes | $403,200 | Q1 2026 | -1.0% |
| Zillow ZHVI | Estimated home value (all homes) | $360,727 | April 2026 | +0.1% |
| Redfin | Median sale price (MLS data) | $436,523 | March 2026 | +1.2% |
| Census Bureau | Average sale price, all homes | $514,600 | Q1 2026 | Flat |
| Census Bureau | Median new home sale price | $387,400 | March 2026 | -6.2% |
The range between the lowest figure ($360,727 from Zillow) and the highest ($436,523 from Redfin) is $75,796. This is not a data error. Each metric measures something genuinely different. Zillow’s ZHVI estimates the value of all 140 million US homes, most of which did not sell.
NAR and Redfin track only completed transactions. The Census Bureau includes new construction, which has been selling at a discount to existing homes since mid-2025.
For most purposes, NAR’s $417,700 is the most widely cited figure and the appropriate benchmark for tracking existing-home market conditions. For articles on this site that reference “the national median home price,” the NAR figure is used unless otherwise specified.
Median Home Price by Year: 2000 to 2026
| Year | Median Price (NAR, Existing Homes) | YoY Change | Key Context |
|---|---|---|---|
| 2000 | $139,000 | +5.3% | Pre-bubble baseline |
| 2001 | $147,800 | +6.3% | Post-9/11, rates cut |
| 2002 | $158,100 | +7.0% | Housing boom begins |
| 2003 | $170,000 | +7.5% | Low rate environment |
| 2004 | $184,100 | +8.3% | Speculative buying accelerates |
| 2005 | $219,600 | +19.3% | Bubble peak begins |
| 2006 | $221,900 | +1.0% | Bubble stalls |
| 2007 | $217,900 | -1.8% | First annual price decline |
| 2008 | $198,600 | -8.9% | Crisis begins |
| 2009 | $173,500 | -12.6% | Deepest correction |
| 2010 | $172,900 | -0.3% | Trough |
| 2011 | $166,100 | -3.9% | Post-crisis low |
| 2012 | $177,200 | +6.7% | Recovery begins |
| 2013 | $197,100 | +11.5% | Investor demand surges |
| 2014 | $208,900 | +6.0% | Recovery continues |
| 2015 | $223,900 | +7.2% | Steady appreciation |
| 2016 | $235,500 | +5.1% | Millennial buyers enter |
| 2017 | $248,800 | +5.6% | Low inventory begins |
| 2018 | $261,600 | +5.1% | Rate rise cools market |
| 2019 | $274,600 | +5.0% | Pre-pandemic baseline |
| 2020 | $300,200 | +9.3% | Pandemic-era surge starts |
| 2021 | $347,500 | +15.7% | Sub-3% rates, bidding wars |
| 2022 | $399,200 | +14.9% | Peak appreciation, rates rise |
| 2023 | $389,800 | -2.4% | First annual decline since 2011 |
| 2024 | $407,500 | +4.5% | Recovery, rates above 7% |
| 2025 | $414,200 | +1.7% | Deceleration deepens |
| 2026 (April) | $417,700 | +0.9% | 34th consecutive YoY gain |
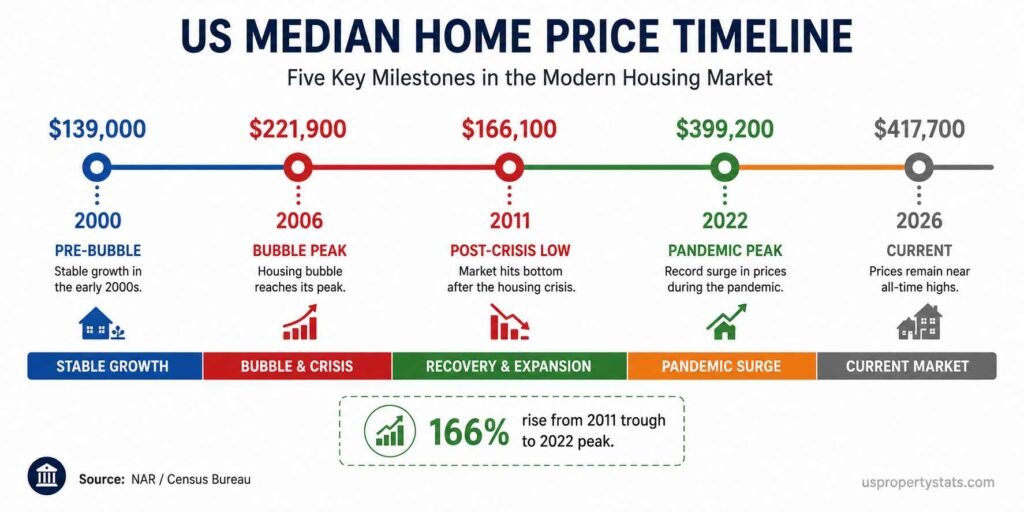
The 25-year data reveals four distinct price eras. The speculative bubble (2002-2006) drove prices up 59% in four years before a two-year stall and collapse. The post-crisis recovery (2012-2019) delivered steady appreciation of 5-7% annually as the market healed.
The pandemic surge (2020-2022) compressed three years of normal appreciation into two, with prices rising 33% from 2019 to 2022. The current affordability-constrained phase (2023-present) has seen appreciation collapse from nearly 15% to under 1%.
The 2011 median of $166,100 represents the lowest annual price in modern housing data. The 2022 annual median of $399,200 represents the highest, though the all-time single-quarter peak was $442,600 in Q3 2022, according to the Census Bureau via FRED. From trough to peak, prices rose 166% over 11 years.
The most significant data point in the table is 2005’s single-year jump of 19.3%. That level of annual appreciation, driven by loose lending standards and speculative demand, preceded the steepest housing correction since the Great Depression.
By contrast, 2021’s 15.7% gain was driven by genuine supply-demand imbalance rather than speculation, which is why it has not produced a comparable correction.
For related context, see US Housing Market Statistics and History of US Housing Market Crashes.
Median Home Price by State: All 50 States Ranked
| # | State | Median Home Value | YoY Change |
|---|---|---|---|
| 1 | Hawaii | $973,555 | +2.1% |
| 2 | California | $809,227 | -1.8% |
| 3 | Massachusetts | $685,886 | +5.2% |
| 4 | Washington | $626,603 | +1.4% |
| 5 | New Jersey | $588,776 | +6.1% |
| 6 | Colorado | $567,724 | -1.3% |
| 7 | Utah | $546,553 | +0.8% |
| 8 | New Hampshire | $528,377 | +4.9% |
| 9 | Oregon | $515,474 | -0.4% |
| 10 | Rhode Island | $506,723 | +4.1% |
| 11 | New York | $487,737 | +3.8% |
| 12 | Nevada | $472,477 | +1.2% |
| 13 | Montana | $467,372 | -0.9% |
| 14 | Connecticut | $465,586 | +5.3% |
| 15 | Idaho | $465,288 | -0.5% |
| 16 | Maryland | $451,121 | +3.2% |
| 17 | Arizona | $440,228 | +0.5% |
| 18 | Virginia | $416,516 | +2.8% |
| 19 | Maine | $413,961 | +3.6% |
| 20 | Vermont | $406,730 | +2.9% |
| 21 | Delaware | $406,448 | +3.1% |
| 22 | Florida | $405,280 | -2.4% |
| 23 | Alaska | $395,096 | +1.3% |
| 24 | Wyoming | $367,126 | -0.7% |
| 25 | Minnesota | $358,473 | +2.1% |
| 26 | North Carolina | $339,287 | +1.8% |
| 27 | Georgia | $338,734 | +1.2% |
| 28 | Tennessee | $335,560 | +1.4% |
| 29 | Wisconsin | $334,636 | +3.3% |
| 30 | South Dakota | $321,393 | +2.6% |
| 31 | New Mexico | $316,778 | +1.9% |
| 32 | Texas | $308,212 | -0.8% |
| 33 | South Carolina | $306,512 | +1.5% |
| 34 | Illinois | $292,156 | +4.6% |
| 35 | North Dakota | $289,622 | +2.3% |
| 36 | Pennsylvania | $286,397 | +3.9% |
| 37 | Nebraska | $277,389 | +2.7% |
| 38 | Missouri | $264,646 | +3.1% |
| 39 | Michigan | $259,702 | +3.6% |
| 40 | Indiana | $254,931 | +3.8% |
| 41 | Ohio | $246,244 | +4.2% |
| 42 | Kansas | $242,859 | +2.9% |
| 43 | Iowa | $237,357 | +2.4% |
| 44 | Alabama | $231,946 | +2.1% |
| 45 | Kentucky | $225,191 | +3.2% |
| 46 | Arkansas | $206,300 | +2.8% |
| 47 | Oklahoma | $200,450 | +1.4% |
| 48 | Louisiana | $198,200 | -0.6% |
| 49 | Mississippi | $176,000 | +1.9% |
| 50 | West Virginia | $155,900 | +3.1% |
The gap between the most and least expensive state is 6.2x: Hawaii’s $973,555 median is more than six times West Virginia’s $155,900. This ratio has widened steadily from approximately 4.5x in 2019, reflecting the pandemic-era surge in high-demand coastal and mountain markets that outpaced affordability constraints.
The nine states with negative year-over-year change are all concentrated in the West (California, Colorado, Oregon, Idaho, Montana) and South (Florida, Texas, Wyoming, Louisiana).
Illinois (+4.6%), New Jersey (+6.1%), Connecticut (+5.3%), and Massachusetts (+5.2%) lead year-over-year gains, consistent with NAR’s Q1 2026 metro data showing the Northeast as the strongest performing region.
These states benefit from relative affordability compared to coastal peers, constrained resale inventory, and migration inflows from New York City and other expensive metros.
Florida’s -2.4% decline deserves specific attention. Florida was the second-fastest appreciating state during 2020-2023, posting peak gains above 30% in some years.
The current correction reflects a convergence of factors: elevated insurance costs following Hurricane Milton (2024) and Hurricane Helene (2024), a surge in new construction across Tampa Bay and Orlando, and affordability exhaustion in markets like Cape Coral and North Port that appreciated beyond local income levels.
For state-level detail, see Florida Housing Market.
For full state-level analysis, see Average Home Price by State and Home Appreciation Rates by State.
New Homes vs Existing Homes: Median Price Comparison
| Year | Median Existing Home Price (NAR) | Median New Home Price (Census) | Premium / Discount |
|---|---|---|---|
| 2019 | $274,600 | $321,500 | New +$46,900 (+17.1%) |
| 2020 | $300,200 | $334,900 | New +$34,700 (+11.6%) |
| 2021 | $347,500 | $383,500 | New +$36,000 (+10.4%) |
| 2022 | $399,200 | $434,500 | New +$35,300 (+8.8%) |
| 2023 | $389,800 | $428,600 | New +$38,800 (+9.9%) |
| 2024 | $407,500 | $420,300 | New +$12,800 (+3.1%) |
| 2025 | $414,200 | $416,600 | New +$2,400 (+0.6%) |
| March 2026 | $408,800 (March) | $387,400 | New -$21,400 (-5.2%) |
The inversion in the new-vs-existing home price relationship is one of the most unusual data points in current housing market statistics. For most of modern housing history, new homes command a premium over existing homes because they offer modern design, energy efficiency, and builder warranties.
That premium averaged approximately 10-17% from 2019 through 2023. By March 2026, new homes are selling at a 5.2% discount to existing homes.
The driver is builder behavior, not construction cost reduction. Builders facing 8.5 months of new home inventory (more than double the existing-home market’s 4.4 months) are cutting base prices, offering mortgage rate buydowns, and absorbing closing costs to move standing inventory.
The NAHB reports that 32% of builders cut prices in May 2026 with an average reduction of 6%, and 61% offered incentives. This is not a market correction; it is an active discounting cycle by an industry carrying excess inventory.
The practical implication for buyers: in markets with active new construction (Sun Belt metros, Texas suburbs, Florida), new homes currently offer better value per dollar than existing homes in comparable locations. This is historically unusual and unlikely to persist past 2026-2027 as builders pull back on starts.
Median Home Price vs Median Household Income: Affordability Ratio
| Year | Median Home Price | Median Household Income | Price-to-Income Ratio | Affordability |
|---|---|---|---|---|
| 2000 | $139,000 | $41,990 | 3.3x | Accessible |
| 2005 | $219,600 | $46,326 | 4.7x | Stretched |
| 2010 | $172,900 | $49,445 | 3.5x | Accessible |
| 2015 | $223,900 | $56,516 | 4.0x | Moderate |
| 2019 | $274,600 | $68,703 | 4.0x | Moderate |
| 2021 | $347,500 | $70,784 | 4.9x | Stretched |
| 2022 | $399,200 | $74,580 | 5.4x | Severely stretched |
| 2023 | $389,800 | $77,540 | 5.0x | Stretched |
| 2024 | $407,500 | $79,200 | 5.1x | Stretched |
| 2026 (est.) | $417,700 | ~$81,000 | 5.2x | Stretched |
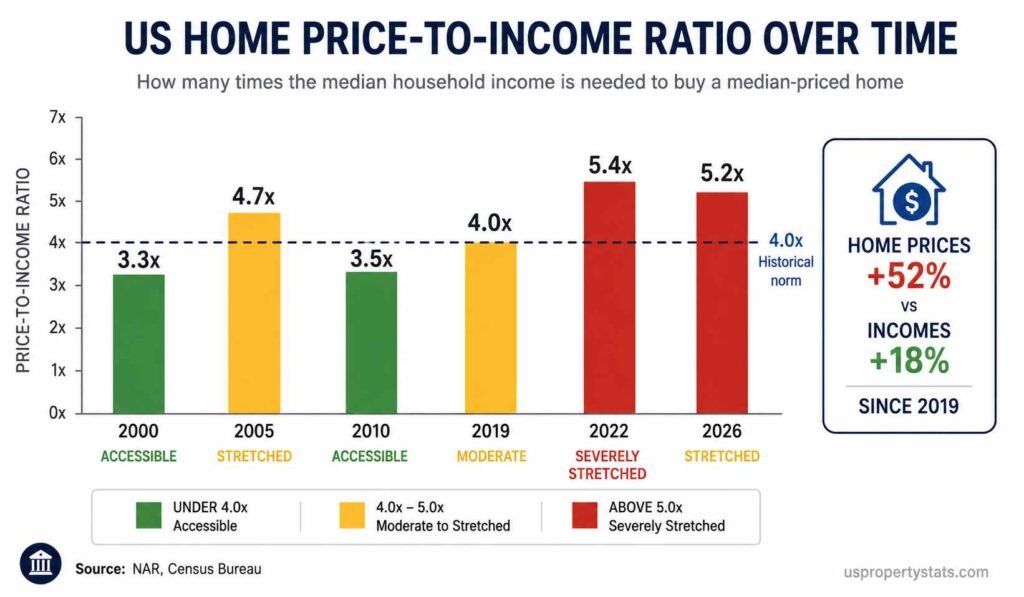
The price-to-income ratio is the most direct measure of housing affordability. A ratio of 3.0-4.0x is generally considered the historical norm for accessible homeownership.
The current ratio of approximately 5.2x means the median home costs 5.2 years of the median household’s gross income, before accounting for taxes or any other expenses. This is 30% above the pre-pandemic ratio of 4.0x recorded in both 2015 and 2019.
The 2022 peak of 5.4x was the worst affordability reading since the mid-2000s bubble. Unlike 2005-2007, however, the current stretched ratio has not been accompanied by loose lending standards or speculative buying.
The Urban Institute notes that today’s buyers have substantially higher credit scores and larger down payments than the 2006-2007 cohort, reducing the risk of a forced-selling cascade that characterized the prior correction.
The ratio has been stubbornly resistant to improvement because prices and incomes have moved in the same direction. From 2019 to 2026, the median home price rose 52% while the median household income rose approximately 18%.
This 34-percentage-point gap is the structural affordability problem driving first-time buyer share to historically low levels. For deeper analysis, see Home Affordability in America and First-Time Home Buyer Statistics.
Metro Areas With the Highest and Lowest Median Home Prices
| # | Metro Area | Median Price | YoY Change |
|---|---|---|---|
| 1 | San Jose-Sunnyvale-Santa Clara, CA | $1,900,000 | +4.1% |
| 2 | San Francisco-Oakland-Berkeley, CA | $1,307,000 | +2.8% |
| 3 | Anaheim-Santa Ana-Irvine, CA | $1,285,000 | +3.2% |
| 4 | Urban Honolulu, HI | $1,110,700 | +1.9% |
| 5 | Los Angeles-Long Beach-Glendale, CA | $935,000 | -0.8% |
| 6 | San Diego-Chula Vista-Carlsbad, CA | $885,000 | +1.4% |
| 7 | Boulder, CO | $820,200 | -1.1% |
| 8 | Seattle-Tacoma-Bellevue, WA | $754,800 | +2.1% |
| 9 | Boston-Cambridge-Newton, MA-NH | $741,500 | +5.6% |
| 10 | New York-Newark-Jersey City, NY-NJ | $695,200 | +4.9% |
| # | Metro Area | Median Price | YoY Change |
|---|---|---|---|
| 1 | Decatur, IL | $115,000 | +3.6% |
| 2 | Cumberland, MD-WV | $123,400 | +5.1% |
| 3 | Elmira, NY | $135,200 | +6.3% |
| 4 | Youngstown-Warren-Boardman, OH-PA | $138,700 | +7.2% |
| 5 | Peoria, IL | $141,200 | +4.8% |
| 6 | Jackson, MI | $148,500 | +5.5% |
| 7 | Binghamton, NY | $155,600 | +8.1% |
| 8 | Springfield, IL | $157,200 | +3.9% |
| 9 | Rockford, IL | $161,800 | +5.2% |
| 10 | Toledo, OH | $165,700 | +6.4% |
The 16.5x gap between San Jose ($1.9M) and Decatur, IL ($115,000) quantifies the extreme geographic dispersion in US housing costs. NAR’s Q1 2026 data shows prices rose in 71% of the 235 tracked metro areas, with 7% posting double-digit gains.
The strongest performers are concentrated in the Northeast (New Jersey, Connecticut, Massachusetts suburbs) and Midwest (Illinois, Ohio, Michigan metros), consistent with the regional data discussed in the US Housing Market Statistics pillar page.
The lowest-priced metros are predominantly in the Rust Belt (Ohio, Illinois, Pennsylvania, upstate New York), where population decline, industrial contraction, and limited remote-work migration have kept prices below the national radar.
Notably, several of these low-price metros are posting strong percentage gains (Binghamton +8.1%, Youngstown +7.2%, Toledo +6.4%) as affordability-driven buyers seek out the remaining accessible markets in the Northeast and Midwest.
For city-level deep dives, see Austin Housing Market, Miami Housing Market, Phoenix Housing Market, and Chicago Housing Market.
2026 Median Home Price Forecasts
| Forecaster | 2026 Price Change | 2027 Price Change | Basis |
|---|---|---|---|
| NAR | +4.0% | N/A | Inventory constraints, income growth |
| Fannie Mae ESR | +3.0% | +2.8% | Modest rate decline, steady demand |
| Realtor.com | +2.2% | N/A | Affordability limits upside |
| Zillow | +1.2% | N/A | Rate environment, inventory building |
| S&P / Reuters Survey | +1.8% | +2.5% | Supply-demand balance |
| J.P. Morgan | 0% (flat) | N/A | Overestimated housing shortage |
The forecast range of 0% to +4.0% for 2026 is wider than typical, reflecting genuine uncertainty about how tariff-related inflation, geopolitical risk, and the trajectory of mortgage rates will interact with housing demand.
The consensus of five forecasters sits at approximately +2.0%, which would bring the April 2026 NAR median to roughly $425,800 by year-end if the consensus holds.
The key variable for all forecasters is mortgage rates. Fannie Mae ESR projects the 30-year fixed rate to end 2026 at approximately 6.3%, down from the current 6.51%.
A sub-6% rate environment, which none of the major forecasters currently expect for 2026, would likely push appreciation toward the upper end of forecasts. Rates holding above 6.5% would validate J.P. Morgan’s flat scenario.
For detailed forecaster analysis and historical accuracy tracking, see Housing Market Predictions and the Housing Market Forecast Comparison 2026.
Byline: USPropertyStats Editorial Team | Last Updated: May 2026 | Next Update: August 2026