Most Expensive Cities to Live in the US: Cost Data Breakdown
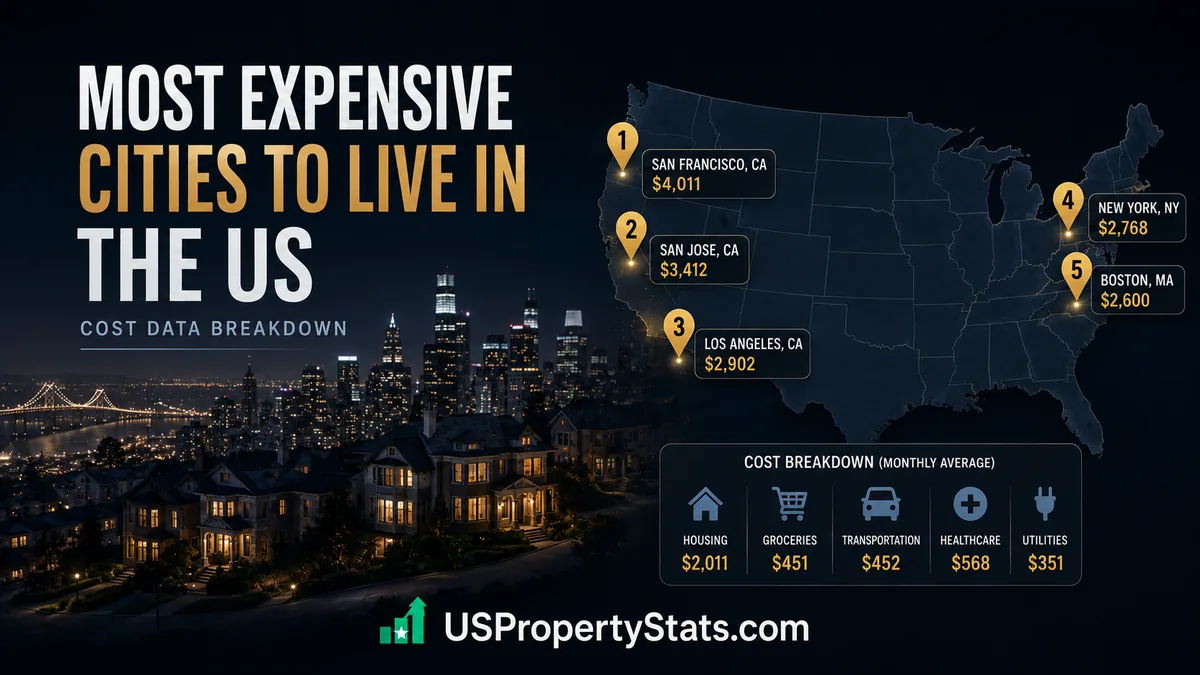
Top 15 most expensive US cities ranked by home price, rent, cost of living index, and income required to buy.

Top 15 most expensive US cities ranked by home price, rent, cost of living index, and income required to buy.
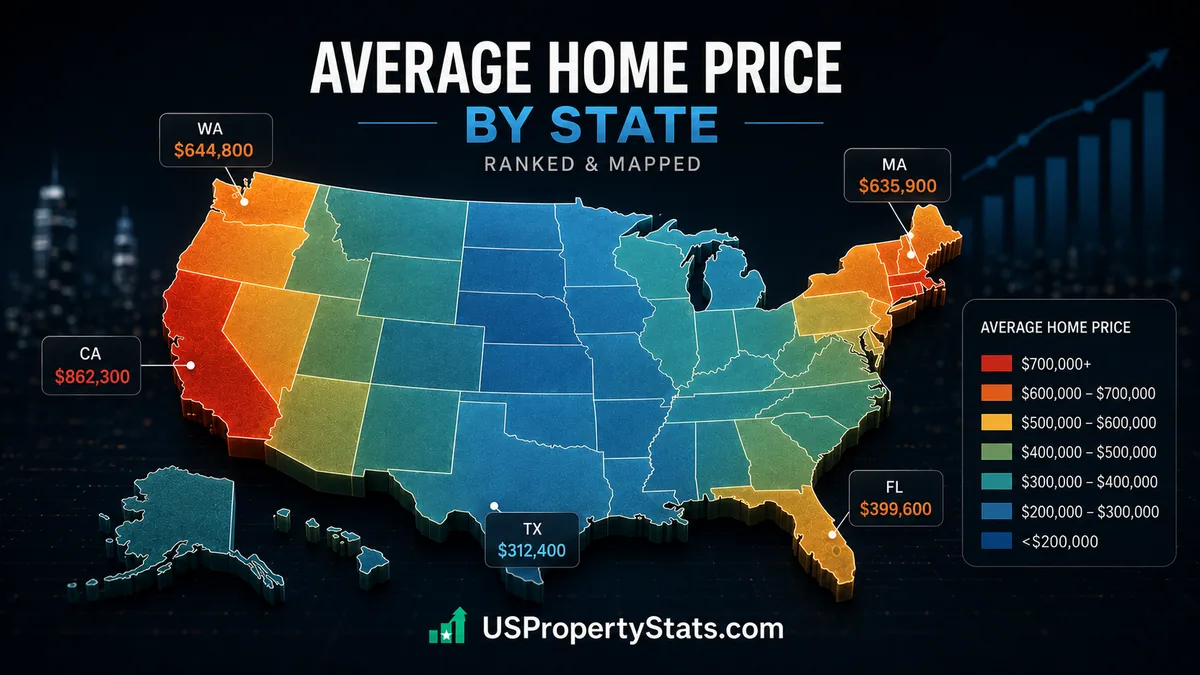
Average home price by state in 2026. Hawaii leads at $832K, West Virginia lowest at $174K. Full 50-state Zillow ranking, price-to-income ratios, 2020-2026 changes.
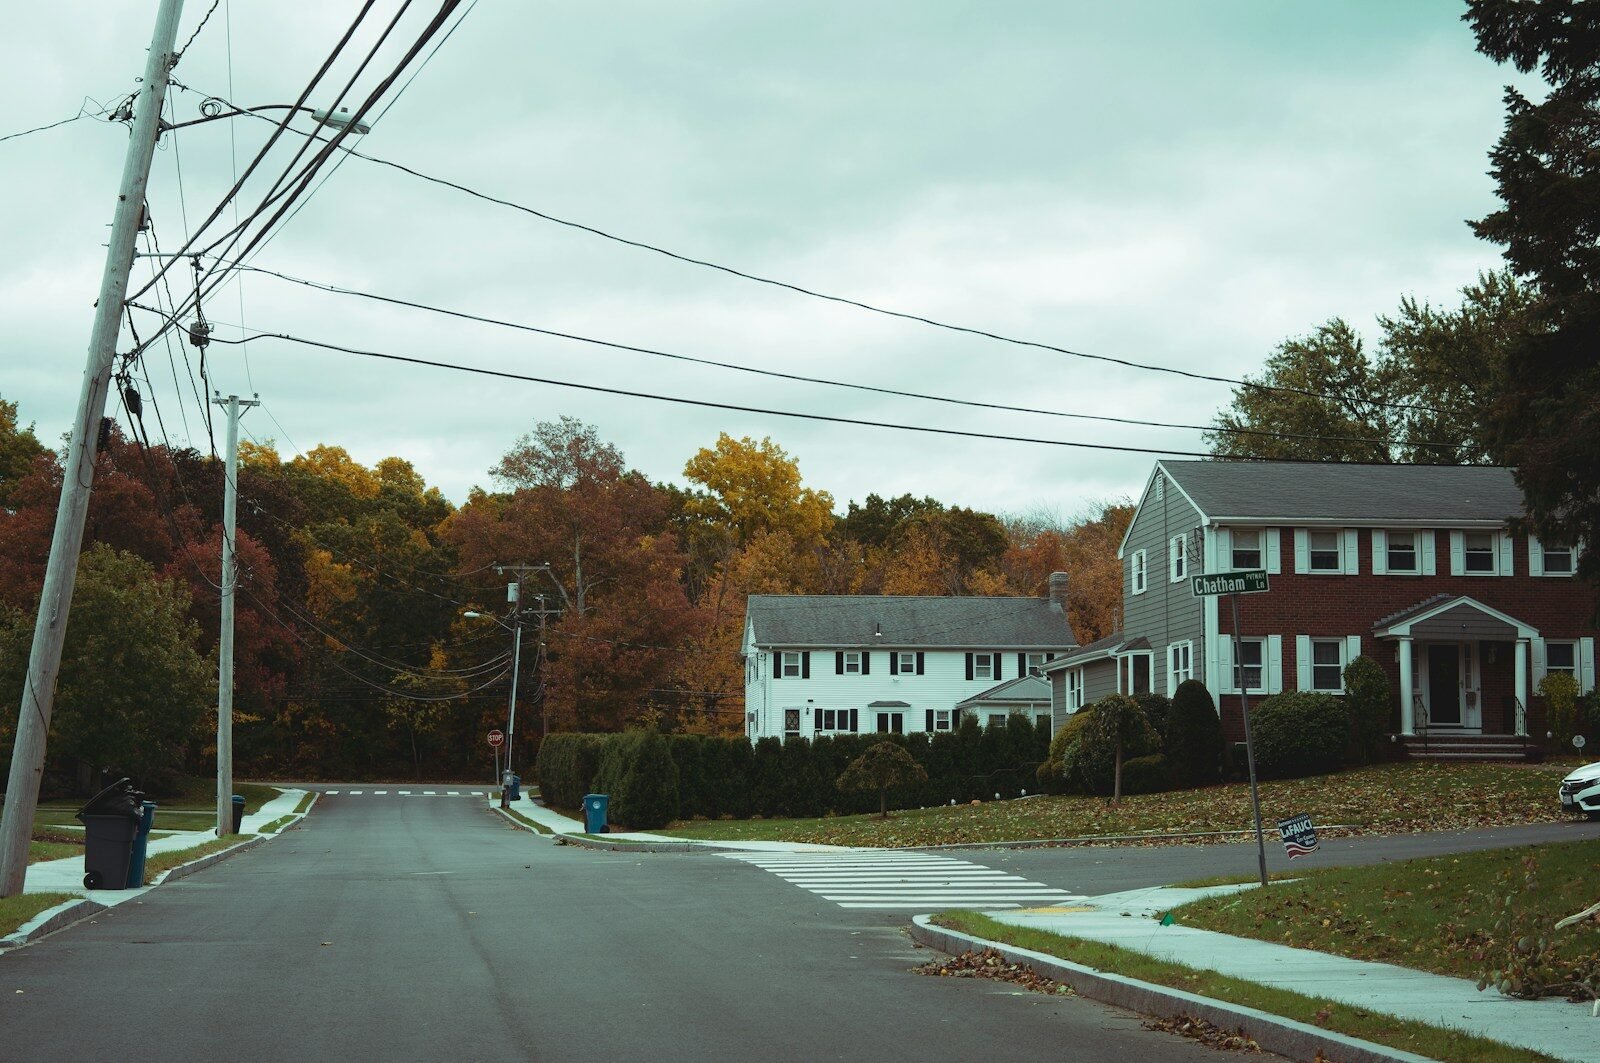
Can you afford a home in 2026? NAR affordability index 110.6. Median household needs $107K+ to qualify. Income vs price gap by state, metro, and rate scenario.

Complete US housing market data by year from 2000 to 2026. Median prices, sales volume, mortgage rates, housing starts. Four market eras analyzed with annual data.

Is it a buyer’s or seller’s market in 2026? Sale-to-list 98.7%, 34% of sellers cutting prices, 25.9% above ask. Five metrics explained with current US data.
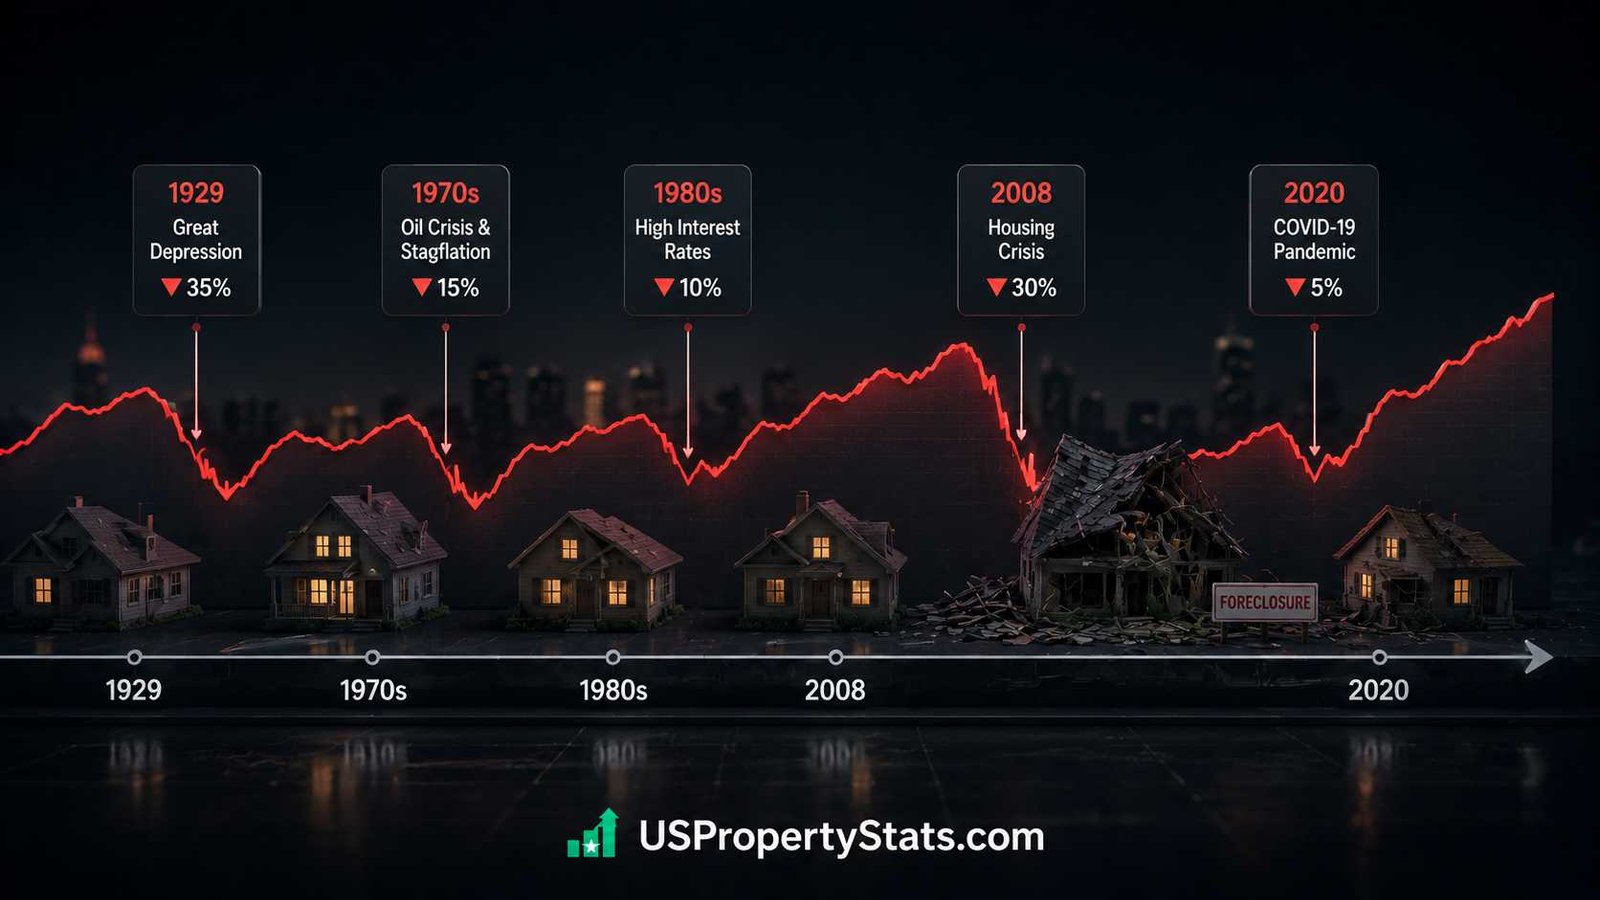
Four US housing market crashes compared: 1929, 1986 S&L crisis, 2008 (-26% national), and 2022 correction. Price data, causes, recovery timelines, and 2026 risk.
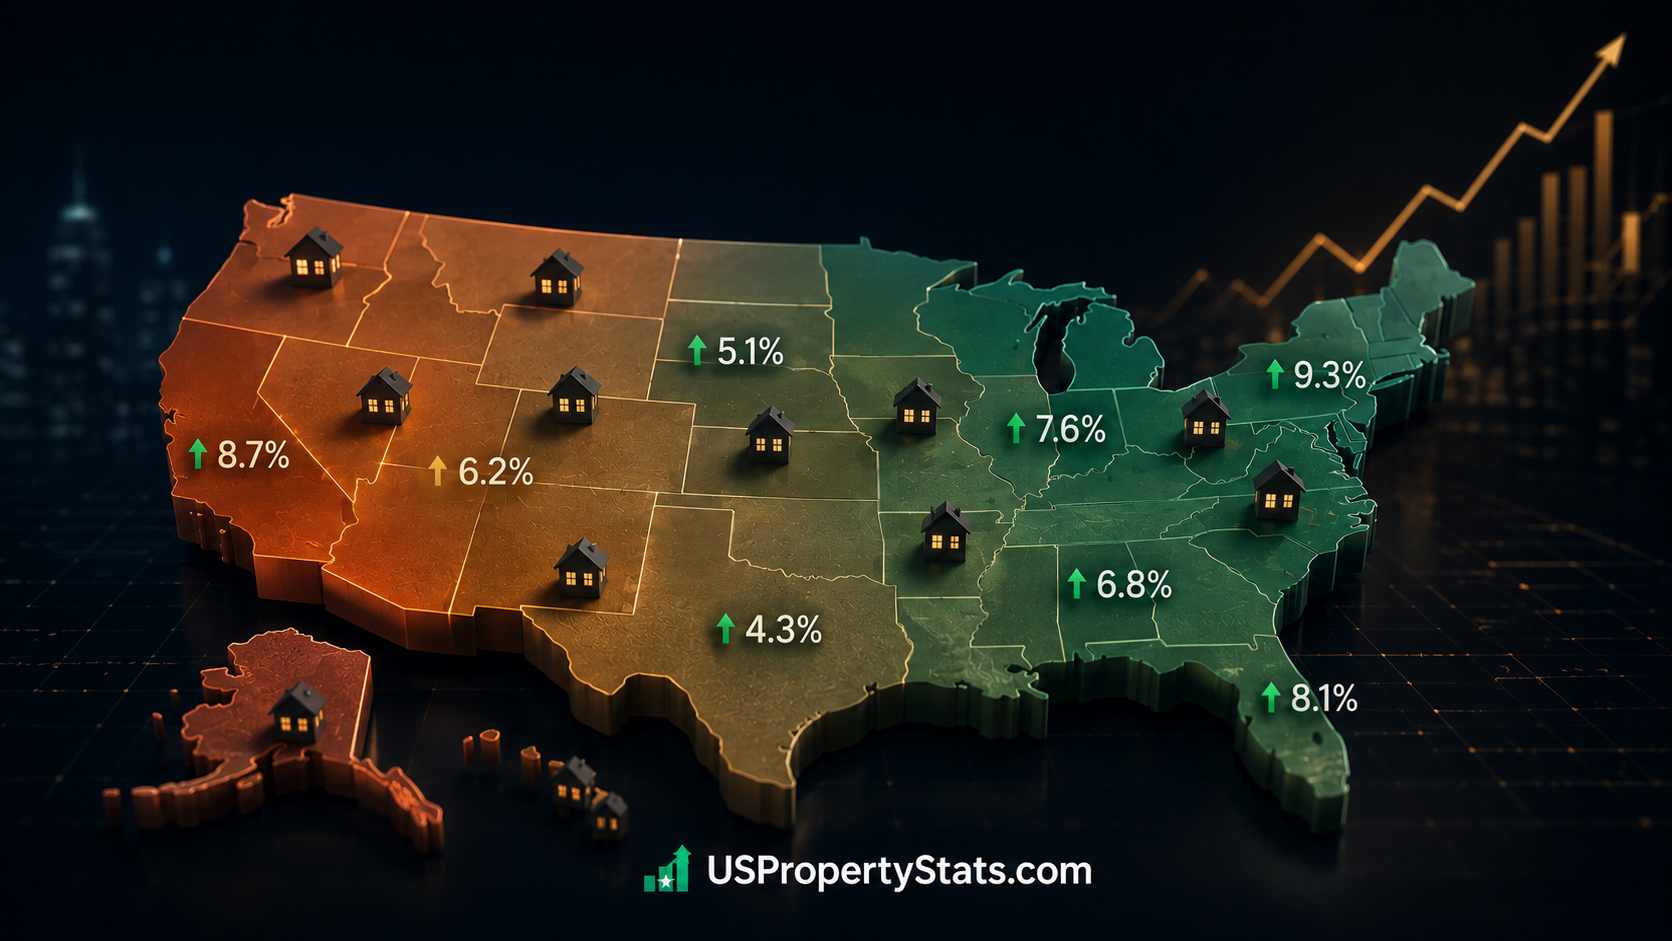
US homes appreciated 1.7% in Q1 2026 (FHFA). Illinois leads at +7.3%. Colorado falls -2.4%. All 50 states ranked by 1-year and 5-year appreciation rates.
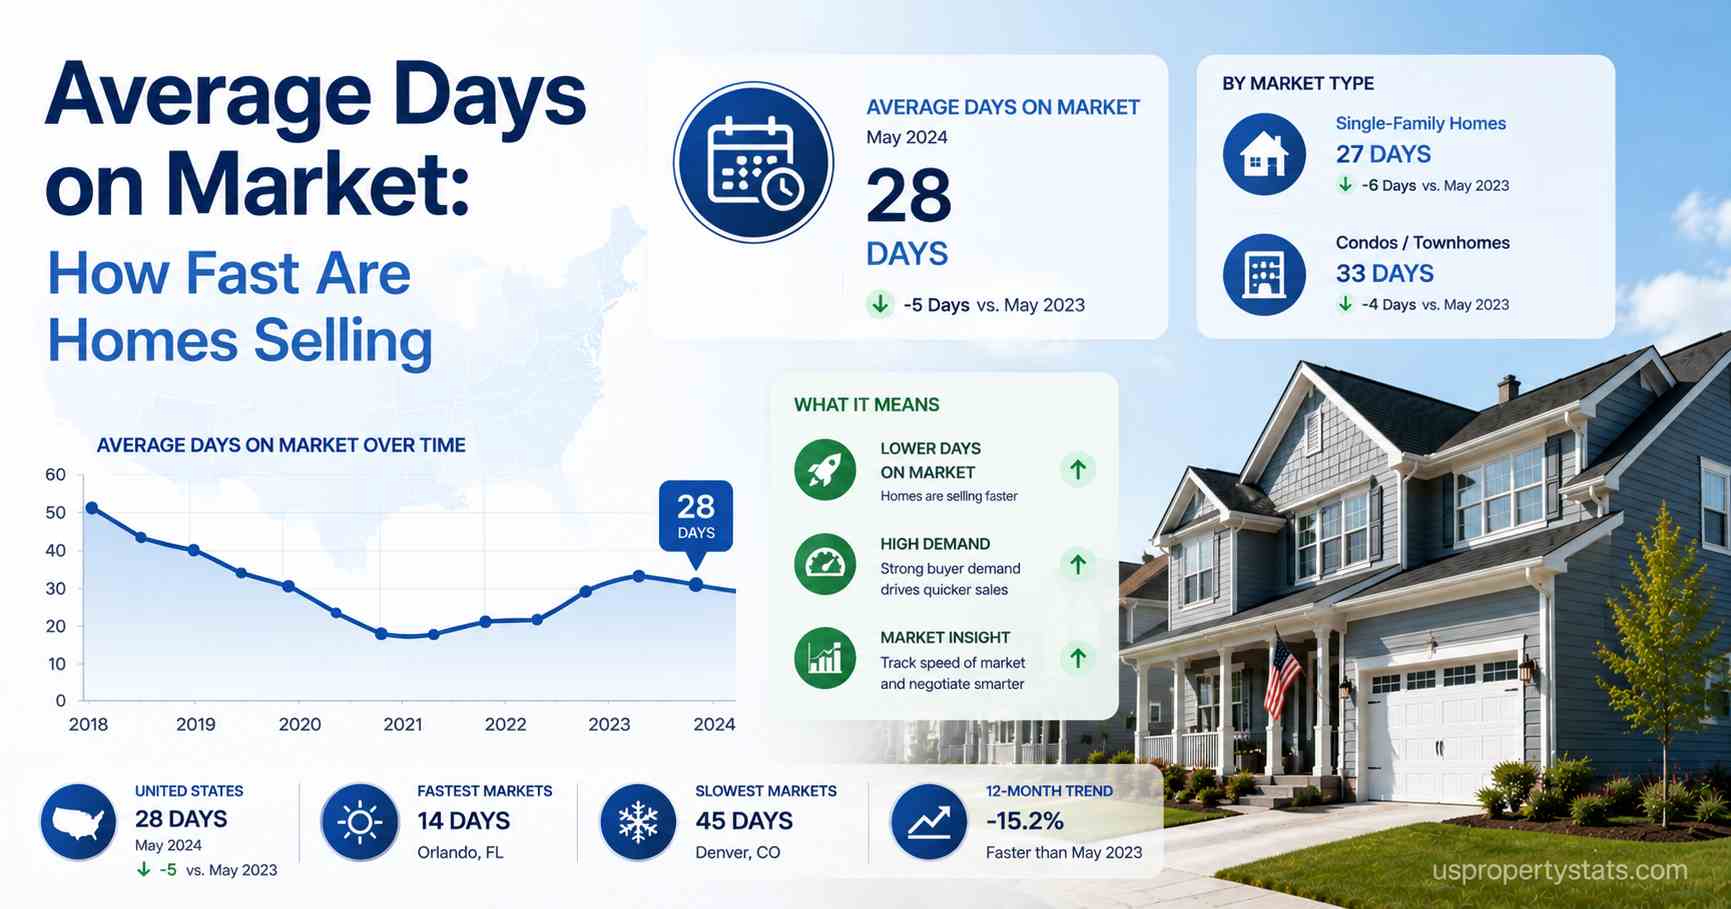
US homes sold in 32 days median (NAR) or 55 days (Redfin) in early 2026. Fastest markets under 7 days. Slowest over 100. Historical trend and metro breakdown.
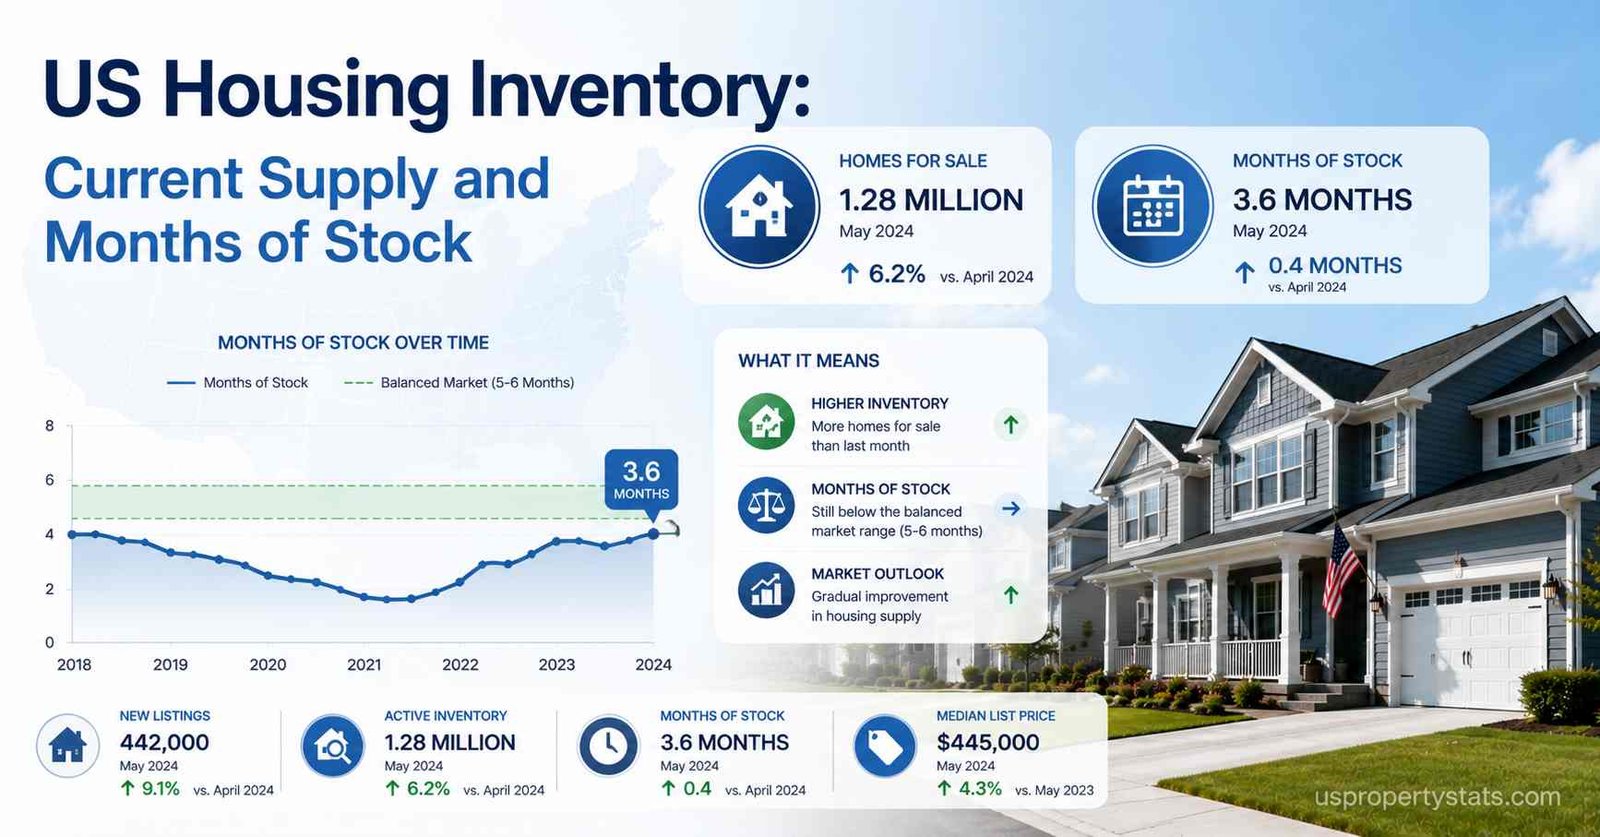
US housing inventory hit 1.47M listings in April 2026 (4.4 months supply), still 20% below pre-pandemic norms. Monthly trend, state breakdown, shortage data.
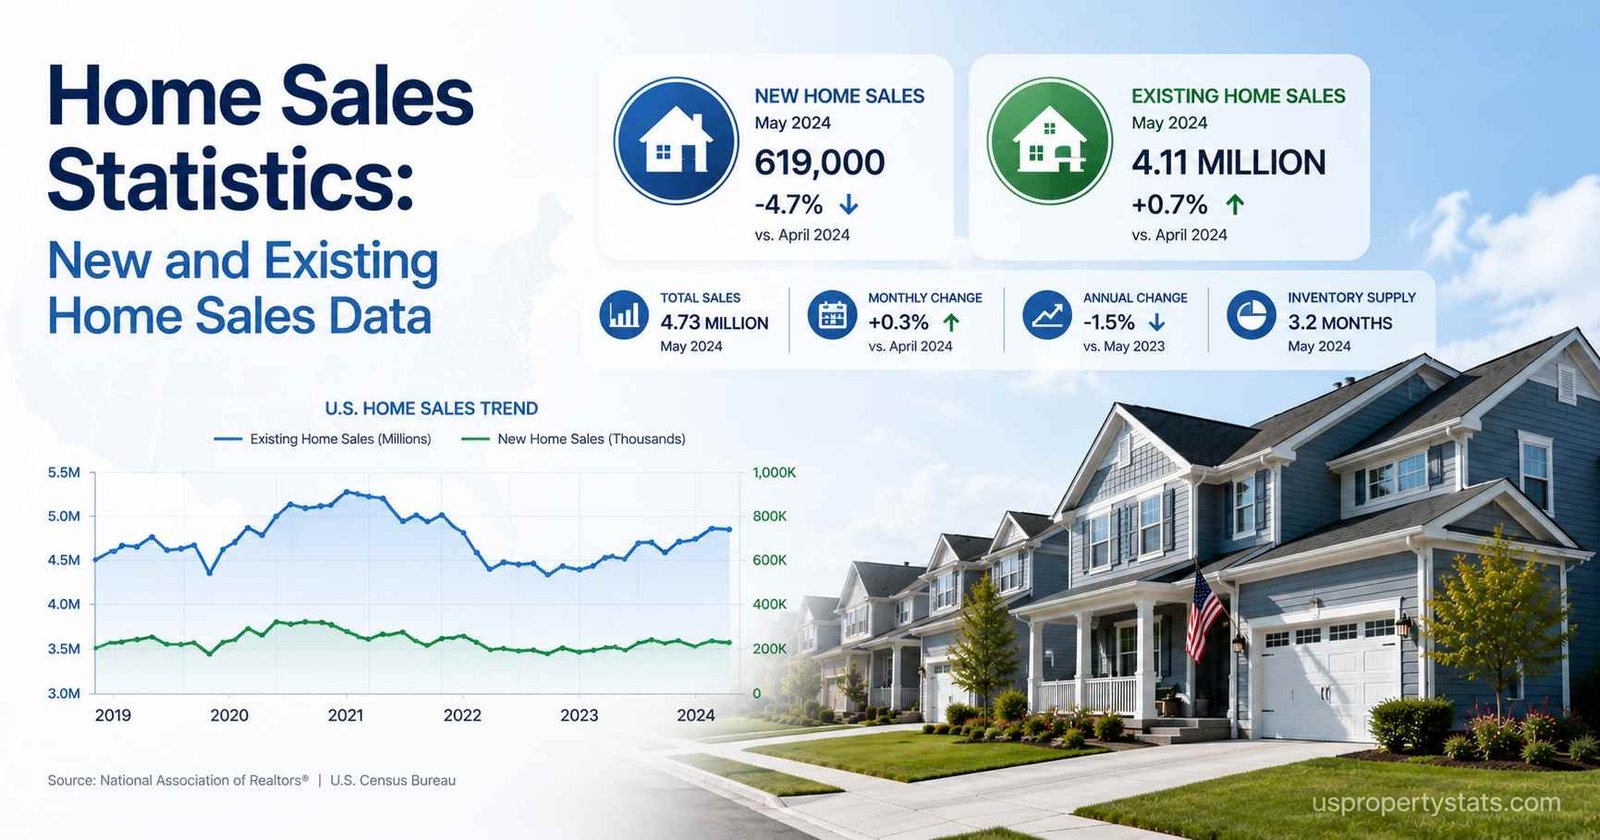
US existing-home sales hit 4.02M SAAR in April 2026. Monthly trend, annual history 2000-2026, regional breakdown, buyer type data. NAR and Census Bureau.