
The 15-Year Homeownership Squeeze: A comprehensive data analysis of how municipal tax levies are quietly consuming American wage growth.

The Squeeze Zone: 2009 to 2024
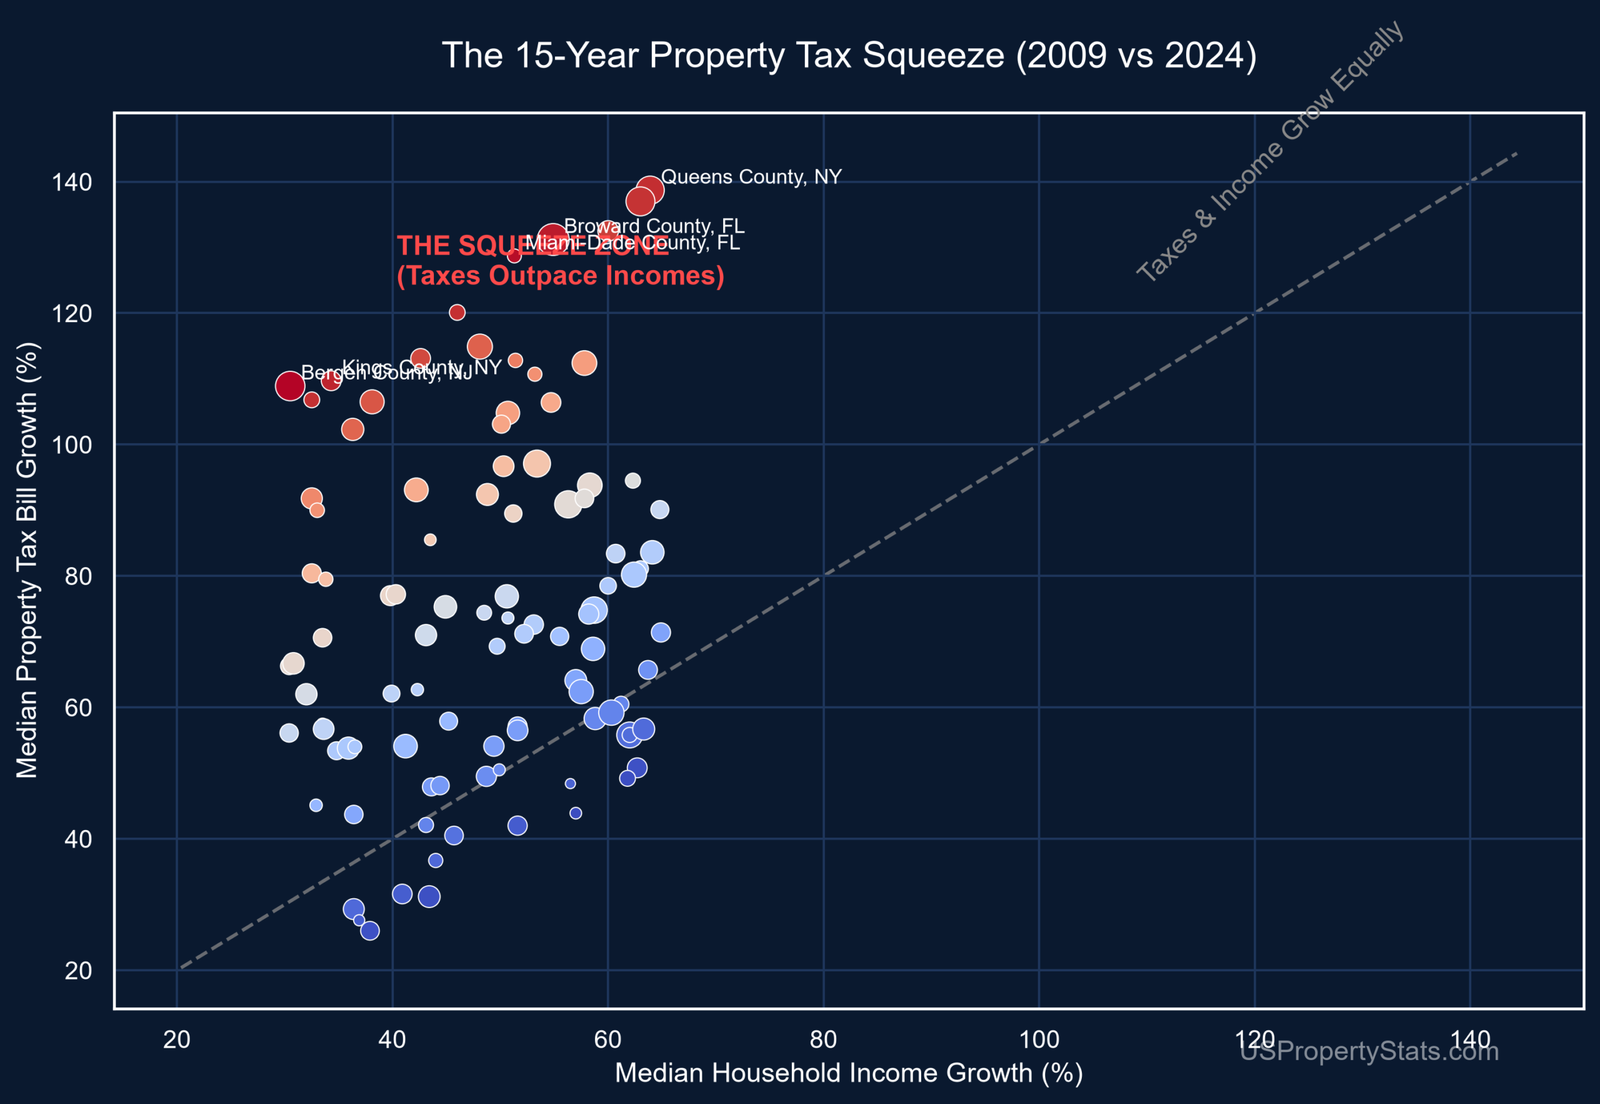
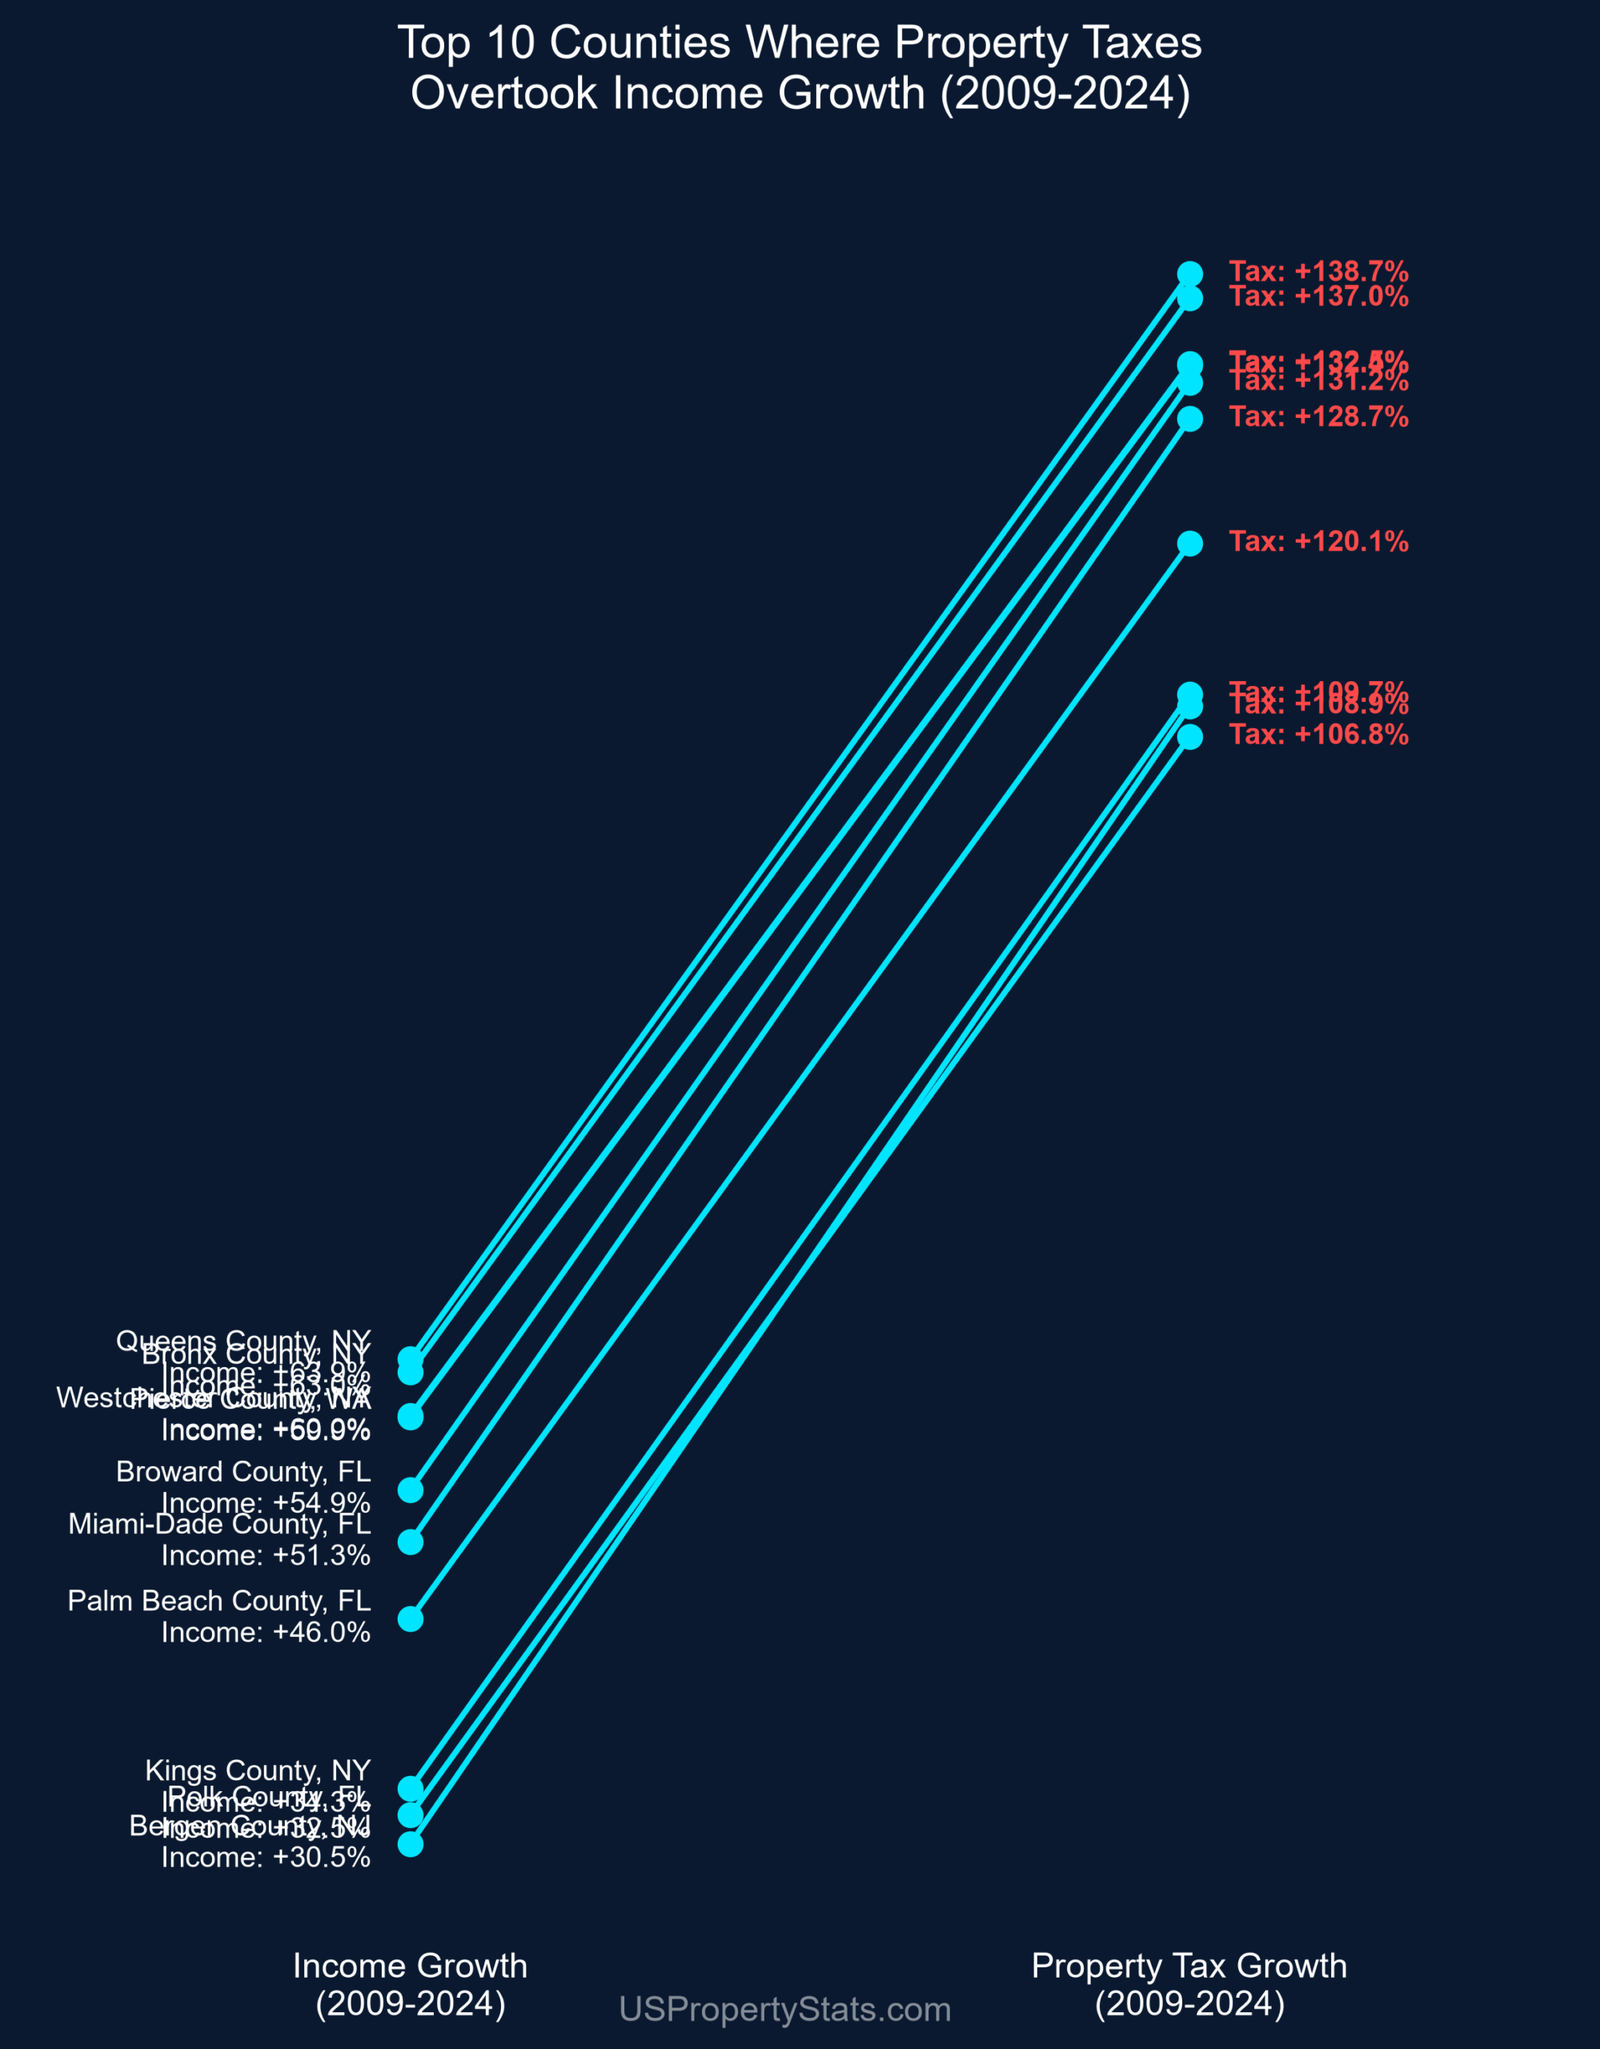
This scatter plot visualizes the exact moment a county enters the “Squeeze Zone” (where tax growth exceeds income growth). The top 10 worst offenders are highlighted.
The Regional Impact: County by County Analysis
We analyzed the US Census ACS 5-year data spanning from 2009 to 2024 for the most populated counties in the United States. While nominal incomes grew across the board, the true homeowner burden is revealed when we compare wage growth directly against the growth of median real estate taxes paid.
Below is our definitive ranking of the counties experiencing the most severe “Squeeze Delta”.
#1: Bergen County, NJ, NJ
Ranking first in our national property tax squeeze index is Bergen County, NJ, located in the state of NJ. Between 2009 and 2024, residents of this county experienced a median household income growth of 30.5%, starting from an estimated $77,635 and rising to $101,345. While on paper this represents significant wage growth, the true cost of homeownership paints a far more burdensome picture.
During that exact same 15-year period, the median property tax bill in Bergen County, NJ surged by an astonishing 108.9%. In 2009, a typical homeowner paid roughly $6,140 annually. Today, that figure has skyrocketed to $12,824.
This creates a critical “Squeeze Delta” of 78.3%. What does this mean for the average family? It means that local municipal levies, driven by rising home assessments and shifting local budgets, have fundamentally outpaced the wage gains of the working class. When property taxes grow faster than income, homeowners are forced to allocate a larger percentage of their take-home pay to the government simply to remain in their homes. For new buyers entering the Bergen County, NJ market, this delta acts as a silent wealth tax, severely limiting their purchasing power and exacerbating the housing affordability crisis. Local policymakers must carefully evaluate these compounding costs against the reality of wage stagnation.
#2: Miami-Dade County, FL, FL
Ranking second in our national property tax squeeze index is Miami-Dade County, FL, located in the state of FL. Between 2009 and 2024, residents of this county experienced a median household income growth of 51.3%, starting from an estimated $48,556 and rising to $73,447. While on paper this represents significant wage growth, the true cost of homeownership paints a far more burdensome picture.
During that exact same 15-year period, the median property tax bill in Miami-Dade County, FL surged by an astonishing 128.7%. In 2009, a typical homeowner paid roughly $1,074 annually. Today, that figure has skyrocketed to $2,456.
This creates a critical “Squeeze Delta” of 77.4%. What does this mean for the average family? It means that local municipal levies, driven by rising home assessments and shifting local budgets, have fundamentally outpaced the wage gains of the working class. When property taxes grow faster than income, homeowners are forced to allocate a larger percentage of their take-home pay to the government simply to remain in their homes. For new buyers entering the Miami-Dade County, FL market, this delta acts as a silent wealth tax, severely limiting their purchasing power and exacerbating the housing affordability crisis. Local policymakers must carefully evaluate these compounding costs against the reality of wage stagnation.
#3: Broward County, FL, FL
Ranking third in our national property tax squeeze index is Broward County, FL, located in the state of FL. Between 2009 and 2024, residents of this county experienced a median household income growth of 54.9%, starting from an estimated $84,504 and rising to $130,894. While on paper this represents significant wage growth, the true cost of homeownership paints a far more burdensome picture.
During that exact same 15-year period, the median property tax bill in Broward County, FL surged by an astonishing 131.2%. In 2009, a typical homeowner paid roughly $6,525 annually. Today, that figure has skyrocketed to $15,086.
This creates a critical “Squeeze Delta” of 76.3%. What does this mean for the average family? It means that local municipal levies, driven by rising home assessments and shifting local budgets, have fundamentally outpaced the wage gains of the working class. When property taxes grow faster than income, homeowners are forced to allocate a larger percentage of their take-home pay to the government simply to remain in their homes. For new buyers entering the Broward County, FL market, this delta acts as a silent wealth tax, severely limiting their purchasing power and exacerbating the housing affordability crisis. Local policymakers must carefully evaluate these compounding costs against the reality of wage stagnation.
#4: Kings County, NY, NY
Ranking fourth in our national property tax squeeze index is Kings County, NY, located in the state of NY. Between 2009 and 2024, residents of this county experienced a median household income growth of 34.3%, starting from an estimated $68,483 and rising to $91,953. While on paper this represents significant wage growth, the true cost of homeownership paints a far more burdensome picture.
During that exact same 15-year period, the median property tax bill in Kings County, NY surged by an astonishing 109.7%. In 2009, a typical homeowner paid roughly $2,621 annually. Today, that figure has skyrocketed to $5,497.
This creates a critical “Squeeze Delta” of 75.5%. What does this mean for the average family? It means that local municipal levies, driven by rising home assessments and shifting local budgets, have fundamentally outpaced the wage gains of the working class. When property taxes grow faster than income, homeowners are forced to allocate a larger percentage of their take-home pay to the government simply to remain in their homes. For new buyers entering the Kings County, NY market, this delta acts as a silent wealth tax, severely limiting their purchasing power and exacerbating the housing affordability crisis. Local policymakers must carefully evaluate these compounding costs against the reality of wage stagnation.
#5: Queens County, NY, NY
Ranking fifth in our national property tax squeeze index is Queens County, NY, located in the state of NY. Between 2009 and 2024, residents of this county experienced a median household income growth of 63.9%, starting from an estimated $54,692 and rising to $89,659. While on paper this represents significant wage growth, the true cost of homeownership paints a far more burdensome picture.
During that exact same 15-year period, the median property tax bill in Queens County, NY surged by an astonishing 138.7%. In 2009, a typical homeowner paid roughly $4,910 annually. Today, that figure has skyrocketed to $11,719.
This creates a critical “Squeeze Delta” of 74.7%. What does this mean for the average family? It means that local municipal levies, driven by rising home assessments and shifting local budgets, have fundamentally outpaced the wage gains of the working class. When property taxes grow faster than income, homeowners are forced to allocate a larger percentage of their take-home pay to the government simply to remain in their homes. For new buyers entering the Queens County, NY market, this delta acts as a silent wealth tax, severely limiting their purchasing power and exacerbating the housing affordability crisis. Local policymakers must carefully evaluate these compounding costs against the reality of wage stagnation.
#6: Polk County, FL, FL
Ranking sixth in our national property tax squeeze index is Polk County, FL, located in the state of FL. Between 2009 and 2024, residents of this county experienced a median household income growth of 32.5%, starting from an estimated $47,368 and rising to $62,754. While on paper this represents significant wage growth, the true cost of homeownership paints a far more burdensome picture.
During that exact same 15-year period, the median property tax bill in Polk County, FL surged by an astonishing 106.8%. In 2009, a typical homeowner paid roughly $1,594 annually. Today, that figure has skyrocketed to $3,296.
This creates a critical “Squeeze Delta” of 74.3%. What does this mean for the average family? It means that local municipal levies, driven by rising home assessments and shifting local budgets, have fundamentally outpaced the wage gains of the working class. When property taxes grow faster than income, homeowners are forced to allocate a larger percentage of their take-home pay to the government simply to remain in their homes. For new buyers entering the Polk County, FL market, this delta acts as a silent wealth tax, severely limiting their purchasing power and exacerbating the housing affordability crisis. Local policymakers must carefully evaluate these compounding costs against the reality of wage stagnation.
#7: Palm Beach County, FL, FL
Ranking seventh in our national property tax squeeze index is Palm Beach County, FL, located in the state of FL. Between 2009 and 2024, residents of this county experienced a median household income growth of 46.0%, starting from an estimated $47,693 and rising to $69,621. While on paper this represents significant wage growth, the true cost of homeownership paints a far more burdensome picture.
During that exact same 15-year period, the median property tax bill in Palm Beach County, FL surged by an astonishing 120.1%. In 2009, a typical homeowner paid roughly $1,489 annually. Today, that figure has skyrocketed to $3,277.
This creates a critical “Squeeze Delta” of 74.2%. What does this mean for the average family? It means that local municipal levies, driven by rising home assessments and shifting local budgets, have fundamentally outpaced the wage gains of the working class. When property taxes grow faster than income, homeowners are forced to allocate a larger percentage of their take-home pay to the government simply to remain in their homes. For new buyers entering the Palm Beach County, FL market, this delta acts as a silent wealth tax, severely limiting their purchasing power and exacerbating the housing affordability crisis. Local policymakers must carefully evaluate these compounding costs against the reality of wage stagnation.
#8: Bronx County, NY, NY
Ranking eighth in our national property tax squeeze index is Bronx County, NY, located in the state of NY. Between 2009 and 2024, residents of this county experienced a median household income growth of 63.0%, starting from an estimated $78,827 and rising to $128,487. While on paper this represents significant wage growth, the true cost of homeownership paints a far more burdensome picture.
During that exact same 15-year period, the median property tax bill in Bronx County, NY surged by an astonishing 137.0%. In 2009, a typical homeowner paid roughly $5,205 annually. Today, that figure has skyrocketed to $12,337.
This creates a critical “Squeeze Delta” of 74.0%. What does this mean for the average family? It means that local municipal levies, driven by rising home assessments and shifting local budgets, have fundamentally outpaced the wage gains of the working class. When property taxes grow faster than income, homeowners are forced to allocate a larger percentage of their take-home pay to the government simply to remain in their homes. For new buyers entering the Bronx County, NY market, this delta acts as a silent wealth tax, severely limiting their purchasing power and exacerbating the housing affordability crisis. Local policymakers must carefully evaluate these compounding costs against the reality of wage stagnation.
#9: Pierce County, WA, WA
Ranking ninth in our national property tax squeeze index is Pierce County, WA, located in the state of WA. Between 2009 and 2024, residents of this county experienced a median household income growth of 59.9%, starting from an estimated $45,699 and rising to $73,052. While on paper this represents significant wage growth, the true cost of homeownership paints a far more burdensome picture.
During that exact same 15-year period, the median property tax bill in Pierce County, WA surged by an astonishing 132.4%. In 2009, a typical homeowner paid roughly $1,627 annually. Today, that figure has skyrocketed to $3,781.
This creates a critical “Squeeze Delta” of 72.6%. What does this mean for the average family? It means that local municipal levies, driven by rising home assessments and shifting local budgets, have fundamentally outpaced the wage gains of the working class. When property taxes grow faster than income, homeowners are forced to allocate a larger percentage of their take-home pay to the government simply to remain in their homes. For new buyers entering the Pierce County, WA market, this delta acts as a silent wealth tax, severely limiting their purchasing power and exacerbating the housing affordability crisis. Local policymakers must carefully evaluate these compounding costs against the reality of wage stagnation.
#10: Westchester County, NY, NY
Ranking tenth in our national property tax squeeze index is Westchester County, NY, located in the state of NY. Between 2009 and 2024, residents of this county experienced a median household income growth of 60.0%, starting from an estimated $46,154 and rising to $73,833. While on paper this represents significant wage growth, the true cost of homeownership paints a far more burdensome picture.
During that exact same 15-year period, the median property tax bill in Westchester County, NY surged by an astonishing 132.5%. In 2009, a typical homeowner paid roughly $2,583 annually. Today, that figure has skyrocketed to $6,005.
This creates a critical “Squeeze Delta” of 72.5%. What does this mean for the average family? It means that local municipal levies, driven by rising home assessments and shifting local budgets, have fundamentally outpaced the wage gains of the working class. When property taxes grow faster than income, homeowners are forced to allocate a larger percentage of their take-home pay to the government simply to remain in their homes. For new buyers entering the Westchester County, NY market, this delta acts as a silent wealth tax, severely limiting their purchasing power and exacerbating the housing affordability crisis. Local policymakers must carefully evaluate these compounding costs against the reality of wage stagnation.
#11: Monroe County, NY, NY
Ranking 11th in our national property tax squeeze index is Monroe County, NY, located in the state of NY. Between 2009 and 2024, residents of this county experienced a median household income growth of 42.6%, starting from an estimated $57,533 and rising to $82,031. While on paper this represents significant wage growth, the true cost of homeownership paints a far more burdensome picture.
During that exact same 15-year period, the median property tax bill in Monroe County, NY surged by an astonishing 113.1%. In 2009, a typical homeowner paid roughly $2,576 annually. Today, that figure has skyrocketed to $5,489.
This creates a critical “Squeeze Delta” of 70.5%. What does this mean for the average family? It means that local municipal levies, driven by rising home assessments and shifting local budgets, have fundamentally outpaced the wage gains of the working class. When property taxes grow faster than income, homeowners are forced to allocate a larger percentage of their take-home pay to the government simply to remain in their homes. For new buyers entering the Monroe County, NY market, this delta acts as a silent wealth tax, severely limiting their purchasing power and exacerbating the housing affordability crisis. Local policymakers must carefully evaluate these compounding costs against the reality of wage stagnation.
#12: New York County, NY, NY
Ranking 12th in our national property tax squeeze index is New York County, NY, located in the state of NY. Between 2009 and 2024, residents of this county experienced a median household income growth of 38.1%, starting from an estimated $74,124 and rising to $102,332. While on paper this represents significant wage growth, the true cost of homeownership paints a far more burdensome picture.
During that exact same 15-year period, the median property tax bill in New York County, NY surged by an astonishing 106.5%. In 2009, a typical homeowner paid roughly $4,047 annually. Today, that figure has skyrocketed to $8,356.
This creates a critical “Squeeze Delta” of 68.4%. What does this mean for the average family? It means that local municipal levies, driven by rising home assessments and shifting local budgets, have fundamentally outpaced the wage gains of the working class. When property taxes grow faster than income, homeowners are forced to allocate a larger percentage of their take-home pay to the government simply to remain in their homes. For new buyers entering the New York County, NY market, this delta acts as a silent wealth tax, severely limiting their purchasing power and exacerbating the housing affordability crisis. Local policymakers must carefully evaluate these compounding costs against the reality of wage stagnation.
#13: Pinellas County, FL, FL
Ranking 13th in our national property tax squeeze index is Pinellas County, FL, located in the state of FL. Between 2009 and 2024, residents of this county experienced a median household income growth of 48.1%, starting from an estimated $50,759 and rising to $75,184. While on paper this represents significant wage growth, the true cost of homeownership paints a far more burdensome picture.
During that exact same 15-year period, the median property tax bill in Pinellas County, FL surged by an astonishing 114.9%. In 2009, a typical homeowner paid roughly $4,252 annually. Today, that figure has skyrocketed to $9,136.
This creates a critical “Squeeze Delta” of 66.8%. What does this mean for the average family? It means that local municipal levies, driven by rising home assessments and shifting local budgets, have fundamentally outpaced the wage gains of the working class. When property taxes grow faster than income, homeowners are forced to allocate a larger percentage of their take-home pay to the government simply to remain in their homes. For new buyers entering the Pinellas County, FL market, this delta acts as a silent wealth tax, severely limiting their purchasing power and exacerbating the housing affordability crisis. Local policymakers must carefully evaluate these compounding costs against the reality of wage stagnation.
#14: Erie County, NY, NY
Ranking 14th in our national property tax squeeze index is Erie County, NY, located in the state of NY. Between 2009 and 2024, residents of this county experienced a median household income growth of 36.3%, starting from an estimated $70,876 and rising to $96,574. While on paper this represents significant wage growth, the true cost of homeownership paints a far more burdensome picture.
During that exact same 15-year period, the median property tax bill in Erie County, NY surged by an astonishing 102.3%. In 2009, a typical homeowner paid roughly $3,485 annually. Today, that figure has skyrocketed to $7,050.
This creates a critical “Squeeze Delta” of 66.0%. What does this mean for the average family? It means that local municipal levies, driven by rising home assessments and shifting local budgets, have fundamentally outpaced the wage gains of the working class. When property taxes grow faster than income, homeowners are forced to allocate a larger percentage of their take-home pay to the government simply to remain in their homes. For new buyers entering the Erie County, NY market, this delta acts as a silent wealth tax, severely limiting their purchasing power and exacerbating the housing affordability crisis. Local policymakers must carefully evaluate these compounding costs against the reality of wage stagnation.
#15: Denton County, TX, TX
Ranking 15th in our national property tax squeeze index is Denton County, TX, located in the state of TX. Between 2009 and 2024, residents of this county experienced a median household income growth of 51.4%, starting from an estimated $74,592 and rising to $112,934. While on paper this represents significant wage growth, the true cost of homeownership paints a far more burdensome picture.
During that exact same 15-year period, the median property tax bill in Denton County, TX surged by an astonishing 112.8%. In 2009, a typical homeowner paid roughly $1,241 annually. Today, that figure has skyrocketed to $2,640.
This creates a critical “Squeeze Delta” of 61.4%. What does this mean for the average family? It means that local municipal levies, driven by rising home assessments and shifting local budgets, have fundamentally outpaced the wage gains of the working class. When property taxes grow faster than income, homeowners are forced to allocate a larger percentage of their take-home pay to the government simply to remain in their homes. For new buyers entering the Denton County, TX market, this delta acts as a silent wealth tax, severely limiting their purchasing power and exacerbating the housing affordability crisis. Local policymakers must carefully evaluate these compounding costs against the reality of wage stagnation.
#16: Brevard County, FL, FL
Ranking 16th in our national property tax squeeze index is Brevard County, FL, located in the state of FL. Between 2009 and 2024, residents of this county experienced a median household income growth of 32.5%, starting from an estimated $72,663 and rising to $96,256. While on paper this represents significant wage growth, the true cost of homeownership paints a far more burdensome picture.
During that exact same 15-year period, the median property tax bill in Brevard County, FL surged by an astonishing 91.8%. In 2009, a typical homeowner paid roughly $3,311 annually. Today, that figure has skyrocketed to $6,349.
This creates a critical “Squeeze Delta” of 59.3%. What does this mean for the average family? It means that local municipal levies, driven by rising home assessments and shifting local budgets, have fundamentally outpaced the wage gains of the working class. When property taxes grow faster than income, homeowners are forced to allocate a larger percentage of their take-home pay to the government simply to remain in their homes. For new buyers entering the Brevard County, FL market, this delta acts as a silent wealth tax, severely limiting their purchasing power and exacerbating the housing affordability crisis. Local policymakers must carefully evaluate these compounding costs against the reality of wage stagnation.
#17: Duval County, FL, FL
Ranking 17th in our national property tax squeeze index is Duval County, FL, located in the state of FL. Between 2009 and 2024, residents of this county experienced a median household income growth of 53.2%, starting from an estimated $83,360 and rising to $127,726. While on paper this represents significant wage growth, the true cost of homeownership paints a far more burdensome picture.
During that exact same 15-year period, the median property tax bill in Duval County, FL surged by an astonishing 110.7%. In 2009, a typical homeowner paid roughly $1,199 annually. Today, that figure has skyrocketed to $2,525.
This creates a critical “Squeeze Delta” of 57.4%. What does this mean for the average family? It means that local municipal levies, driven by rising home assessments and shifting local budgets, have fundamentally outpaced the wage gains of the working class. When property taxes grow faster than income, homeowners are forced to allocate a larger percentage of their take-home pay to the government simply to remain in their homes. For new buyers entering the Duval County, FL market, this delta acts as a silent wealth tax, severely limiting their purchasing power and exacerbating the housing affordability crisis. Local policymakers must carefully evaluate these compounding costs against the reality of wage stagnation.
#18: Essex County, NJ, NJ
Ranking 18th in our national property tax squeeze index is Essex County, NJ, located in the state of NJ. Between 2009 and 2024, residents of this county experienced a median household income growth of 33.0%, starting from an estimated $66,606 and rising to $88,577. While on paper this represents significant wage growth, the true cost of homeownership paints a far more burdensome picture.
During that exact same 15-year period, the median property tax bill in Essex County, NJ surged by an astonishing 90.0%. In 2009, a typical homeowner paid roughly $1,431 annually. Today, that figure has skyrocketed to $2,719.
This creates a critical “Squeeze Delta” of 57.0%. What does this mean for the average family? It means that local municipal levies, driven by rising home assessments and shifting local budgets, have fundamentally outpaced the wage gains of the working class. When property taxes grow faster than income, homeowners are forced to allocate a larger percentage of their take-home pay to the government simply to remain in their homes. For new buyers entering the Essex County, NJ market, this delta acts as a silent wealth tax, severely limiting their purchasing power and exacerbating the housing affordability crisis. Local policymakers must carefully evaluate these compounding costs against the reality of wage stagnation.
#19: Collin County, TX, TX
Ranking 19th in our national property tax squeeze index is Collin County, TX, located in the state of TX. Between 2009 and 2024, residents of this county experienced a median household income growth of 57.8%, starting from an estimated $75,746 and rising to $119,541. While on paper this represents significant wage growth, the true cost of homeownership paints a far more burdensome picture.
During that exact same 15-year period, the median property tax bill in Collin County, TX surged by an astonishing 112.4%. In 2009, a typical homeowner paid roughly $4,166 annually. Today, that figure has skyrocketed to $8,850.
This creates a critical “Squeeze Delta” of 54.6%. What does this mean for the average family? It means that local municipal levies, driven by rising home assessments and shifting local budgets, have fundamentally outpaced the wage gains of the working class. When property taxes grow faster than income, homeowners are forced to allocate a larger percentage of their take-home pay to the government simply to remain in their homes. For new buyers entering the Collin County, TX market, this delta acts as a silent wealth tax, severely limiting their purchasing power and exacerbating the housing affordability crisis. Local policymakers must carefully evaluate these compounding costs against the reality of wage stagnation.
#20: Arapahoe County, CO, CO
Ranking 20th in our national property tax squeeze index is Arapahoe County, CO, located in the state of CO. Between 2009 and 2024, residents of this county experienced a median household income growth of 50.7%, starting from an estimated $82,080 and rising to $123,707. While on paper this represents significant wage growth, the true cost of homeownership paints a far more burdensome picture.
During that exact same 15-year period, the median property tax bill in Arapahoe County, CO surged by an astonishing 104.8%. In 2009, a typical homeowner paid roughly $3,858 annually. Today, that figure has skyrocketed to $7,901.
This creates a critical “Squeeze Delta” of 54.1%. What does this mean for the average family? It means that local municipal levies, driven by rising home assessments and shifting local budgets, have fundamentally outpaced the wage gains of the working class. When property taxes grow faster than income, homeowners are forced to allocate a larger percentage of their take-home pay to the government simply to remain in their homes. For new buyers entering the Arapahoe County, CO market, this delta acts as a silent wealth tax, severely limiting their purchasing power and exacerbating the housing affordability crisis. Local policymakers must carefully evaluate these compounding costs against the reality of wage stagnation.
#21: Volusia County, FL, FL
Ranking 21th in our national property tax squeeze index is Volusia County, FL, located in the state of FL. Between 2009 and 2024, residents of this county experienced a median household income growth of 50.1%, starting from an estimated $45,851 and rising to $68,841. While on paper this represents significant wage growth, the true cost of homeownership paints a far more burdensome picture.
During that exact same 15-year period, the median property tax bill in Volusia County, FL surged by an astonishing 103.1%. In 2009, a typical homeowner paid roughly $2,215 annually. Today, that figure has skyrocketed to $4,497.
This creates a critical “Squeeze Delta” of 52.9%. What does this mean for the average family? It means that local municipal levies, driven by rising home assessments and shifting local budgets, have fundamentally outpaced the wage gains of the working class. When property taxes grow faster than income, homeowners are forced to allocate a larger percentage of their take-home pay to the government simply to remain in their homes. For new buyers entering the Volusia County, FL market, this delta acts as a silent wealth tax, severely limiting their purchasing power and exacerbating the housing affordability crisis. Local policymakers must carefully evaluate these compounding costs against the reality of wage stagnation.
#22: Spokane County, WA, WA
Ranking 22th in our national property tax squeeze index is Spokane County, WA, located in the state of WA. Between 2009 and 2024, residents of this county experienced a median household income growth of 54.7%, starting from an estimated $83,069 and rising to $128,489. While on paper this represents significant wage growth, the true cost of homeownership paints a far more burdensome picture.
During that exact same 15-year period, the median property tax bill in Spokane County, WA surged by an astonishing 106.4%. In 2009, a typical homeowner paid roughly $2,618 annually. Today, that figure has skyrocketed to $5,403.
This creates a critical “Squeeze Delta” of 51.7%. What does this mean for the average family? It means that local municipal levies, driven by rising home assessments and shifting local budgets, have fundamentally outpaced the wage gains of the working class. When property taxes grow faster than income, homeowners are forced to allocate a larger percentage of their take-home pay to the government simply to remain in their homes. For new buyers entering the Spokane County, WA market, this delta acts as a silent wealth tax, severely limiting their purchasing power and exacerbating the housing affordability crisis. Local policymakers must carefully evaluate these compounding costs against the reality of wage stagnation.
#23: Jefferson County, CO, CO
Ranking 23th in our national property tax squeeze index is Jefferson County, CO, located in the state of CO. Between 2009 and 2024, residents of this county experienced a median household income growth of 42.2%, starting from an estimated $69,052 and rising to $98,186. While on paper this represents significant wage growth, the true cost of homeownership paints a far more burdensome picture.
During that exact same 15-year period, the median property tax bill in Jefferson County, CO surged by an astonishing 93.1%. In 2009, a typical homeowner paid roughly $4,225 annually. Today, that figure has skyrocketed to $8,158.
This creates a critical “Squeeze Delta” of 50.9%. What does this mean for the average family? It means that local municipal levies, driven by rising home assessments and shifting local budgets, have fundamentally outpaced the wage gains of the working class. When property taxes grow faster than income, homeowners are forced to allocate a larger percentage of their take-home pay to the government simply to remain in their homes. For new buyers entering the Jefferson County, CO market, this delta acts as a silent wealth tax, severely limiting their purchasing power and exacerbating the housing affordability crisis. Local policymakers must carefully evaluate these compounding costs against the reality of wage stagnation.
#24: El Paso County, TX, TX
Ranking 24th in our national property tax squeeze index is El Paso County, TX, located in the state of TX. Between 2009 and 2024, residents of this county experienced a median household income growth of 32.5%, starting from an estimated $79,663 and rising to $105,525. While on paper this represents significant wage growth, the true cost of homeownership paints a far more burdensome picture.
During that exact same 15-year period, the median property tax bill in El Paso County, TX surged by an astonishing 80.4%. In 2009, a typical homeowner paid roughly $2,809 annually. Today, that figure has skyrocketed to $5,067.
This creates a critical “Squeeze Delta” of 47.9%. What does this mean for the average family? It means that local municipal levies, driven by rising home assessments and shifting local budgets, have fundamentally outpaced the wage gains of the working class. When property taxes grow faster than income, homeowners are forced to allocate a larger percentage of their take-home pay to the government simply to remain in their homes. For new buyers entering the El Paso County, TX market, this delta acts as a silent wealth tax, severely limiting their purchasing power and exacerbating the housing affordability crisis. Local policymakers must carefully evaluate these compounding costs against the reality of wage stagnation.
#25: Middlesex County, NJ, NJ
Ranking 25th in our national property tax squeeze index is Middlesex County, NJ, located in the state of NJ. Between 2009 and 2024, residents of this county experienced a median household income growth of 50.3%, starting from an estimated $58,403 and rising to $87,756. While on paper this represents significant wage growth, the true cost of homeownership paints a far more burdensome picture.
During that exact same 15-year period, the median property tax bill in Middlesex County, NJ surged by an astonishing 96.7%. In 2009, a typical homeowner paid roughly $3,091 annually. Today, that figure has skyrocketed to $6,079.
This creates a critical “Squeeze Delta” of 46.4%. What does this mean for the average family? It means that local municipal levies, driven by rising home assessments and shifting local budgets, have fundamentally outpaced the wage gains of the working class. When property taxes grow faster than income, homeowners are forced to allocate a larger percentage of their take-home pay to the government simply to remain in their homes. For new buyers entering the Middlesex County, NJ market, this delta acts as a silent wealth tax, severely limiting their purchasing power and exacerbating the housing affordability crisis. Local policymakers must carefully evaluate these compounding costs against the reality of wage stagnation.
#26: Suffolk County, NY, NY
Ranking 26th in our national property tax squeeze index is Suffolk County, NY, located in the state of NY. Between 2009 and 2024, residents of this county experienced a median household income growth of 33.8%, starting from an estimated $68,419 and rising to $91,528. While on paper this represents significant wage growth, the true cost of homeownership paints a far more burdensome picture.
During that exact same 15-year period, the median property tax bill in Suffolk County, NY surged by an astonishing 79.5%. In 2009, a typical homeowner paid roughly $1,452 annually. Today, that figure has skyrocketed to $2,606.
This creates a critical “Squeeze Delta” of 45.7%. What does this mean for the average family? It means that local municipal levies, driven by rising home assessments and shifting local budgets, have fundamentally outpaced the wage gains of the working class. When property taxes grow faster than income, homeowners are forced to allocate a larger percentage of their take-home pay to the government simply to remain in their homes. For new buyers entering the Suffolk County, NY market, this delta acts as a silent wealth tax, severely limiting their purchasing power and exacerbating the housing affordability crisis. Local policymakers must carefully evaluate these compounding costs against the reality of wage stagnation.
#27: Bexar County, TX, TX
Ranking 27th in our national property tax squeeze index is Bexar County, TX, located in the state of TX. Between 2009 and 2024, residents of this county experienced a median household income growth of 53.4%, starting from an estimated $80,222 and rising to $123,068. While on paper this represents significant wage growth, the true cost of homeownership paints a far more burdensome picture.
During that exact same 15-year period, the median property tax bill in Bexar County, TX surged by an astonishing 97.1%. In 2009, a typical homeowner paid roughly $5,411 annually. Today, that figure has skyrocketed to $10,667.
This creates a critical “Squeeze Delta” of 43.7%. What does this mean for the average family? It means that local municipal levies, driven by rising home assessments and shifting local budgets, have fundamentally outpaced the wage gains of the working class. When property taxes grow faster than income, homeowners are forced to allocate a larger percentage of their take-home pay to the government simply to remain in their homes. For new buyers entering the Bexar County, TX market, this delta acts as a silent wealth tax, severely limiting their purchasing power and exacerbating the housing affordability crisis. Local policymakers must carefully evaluate these compounding costs against the reality of wage stagnation.
#28: Snohomish County, WA, WA
Ranking 28th in our national property tax squeeze index is Snohomish County, WA, located in the state of WA. Between 2009 and 2024, residents of this county experienced a median household income growth of 48.8%, starting from an estimated $74,749 and rising to $111,224. While on paper this represents significant wage growth, the true cost of homeownership paints a far more burdensome picture.
During that exact same 15-year period, the median property tax bill in Snohomish County, WA surged by an astonishing 92.4%. In 2009, a typical homeowner paid roughly $3,582 annually. Today, that figure has skyrocketed to $6,890.
This creates a critical “Squeeze Delta” of 43.6%. What does this mean for the average family? It means that local municipal levies, driven by rising home assessments and shifting local budgets, have fundamentally outpaced the wage gains of the working class. When property taxes grow faster than income, homeowners are forced to allocate a larger percentage of their take-home pay to the government simply to remain in their homes. For new buyers entering the Snohomish County, WA market, this delta acts as a silent wealth tax, severely limiting their purchasing power and exacerbating the housing affordability crisis. Local policymakers must carefully evaluate these compounding costs against the reality of wage stagnation.
#29: Dallas County, TX, TX
Ranking 29th in our national property tax squeeze index is Dallas County, TX, located in the state of TX. Between 2009 and 2024, residents of this county experienced a median household income growth of 43.5%, starting from an estimated $53,433 and rising to $76,670. While on paper this represents significant wage growth, the true cost of homeownership paints a far more burdensome picture.
During that exact same 15-year period, the median property tax bill in Dallas County, TX surged by an astonishing 85.5%. In 2009, a typical homeowner paid roughly $841 annually. Today, that figure has skyrocketed to $1,560.
This creates a critical “Squeeze Delta” of 42.1%. What does this mean for the average family? It means that local municipal levies, driven by rising home assessments and shifting local budgets, have fundamentally outpaced the wage gains of the working class. When property taxes grow faster than income, homeowners are forced to allocate a larger percentage of their take-home pay to the government simply to remain in their homes. For new buyers entering the Dallas County, TX market, this delta acts as a silent wealth tax, severely limiting their purchasing power and exacerbating the housing affordability crisis. Local policymakers must carefully evaluate these compounding costs against the reality of wage stagnation.
#30: Tarrant County, TX, TX
Ranking 30th in our national property tax squeeze index is Tarrant County, TX, located in the state of TX. Between 2009 and 2024, residents of this county experienced a median household income growth of 51.2%, starting from an estimated $66,243 and rising to $100,190. While on paper this represents significant wage growth, the true cost of homeownership paints a far more burdensome picture.
During that exact same 15-year period, the median property tax bill in Tarrant County, TX surged by an astonishing 89.5%. In 2009, a typical homeowner paid roughly $2,155 annually. Today, that figure has skyrocketed to $4,083.
This creates a critical “Squeeze Delta” of 38.3%. What does this mean for the average family? It means that local municipal levies, driven by rising home assessments and shifting local budgets, have fundamentally outpaced the wage gains of the working class. When property taxes grow faster than income, homeowners are forced to allocate a larger percentage of their take-home pay to the government simply to remain in their homes. For new buyers entering the Tarrant County, TX market, this delta acts as a silent wealth tax, severely limiting their purchasing power and exacerbating the housing affordability crisis. Local policymakers must carefully evaluate these compounding costs against the reality of wage stagnation.
#31: Travis County, TX, TX
Ranking 31th in our national property tax squeeze index is Travis County, TX, located in the state of TX. Between 2009 and 2024, residents of this county experienced a median household income growth of 39.8%, starting from an estimated $45,854 and rising to $64,082. While on paper this represents significant wage growth, the true cost of homeownership paints a far more burdensome picture.
During that exact same 15-year period, the median property tax bill in Travis County, TX surged by an astonishing 77.0%. In 2009, a typical homeowner paid roughly $3,164 annually. Today, that figure has skyrocketed to $5,600.
This creates a critical “Squeeze Delta” of 37.2%. What does this mean for the average family? It means that local municipal levies, driven by rising home assessments and shifting local budgets, have fundamentally outpaced the wage gains of the working class. When property taxes grow faster than income, homeowners are forced to allocate a larger percentage of their take-home pay to the government simply to remain in their homes. For new buyers entering the Travis County, TX market, this delta acts as a silent wealth tax, severely limiting their purchasing power and exacerbating the housing affordability crisis. Local policymakers must carefully evaluate these compounding costs against the reality of wage stagnation.
#32: Cook County, IL, IL
Ranking 32th in our national property tax squeeze index is Cook County, IL, located in the state of IL. Between 2009 and 2024, residents of this county experienced a median household income growth of 33.5%, starting from an estimated $61,850 and rising to $82,569. While on paper this represents significant wage growth, the true cost of homeownership paints a far more burdensome picture.
During that exact same 15-year period, the median property tax bill in Cook County, IL surged by an astonishing 70.6%. In 2009, a typical homeowner paid roughly $2,778 annually. Today, that figure has skyrocketed to $4,740.
This creates a critical “Squeeze Delta” of 37.1%. What does this mean for the average family? It means that local municipal levies, driven by rising home assessments and shifting local budgets, have fundamentally outpaced the wage gains of the working class. When property taxes grow faster than income, homeowners are forced to allocate a larger percentage of their take-home pay to the government simply to remain in their homes. For new buyers entering the Cook County, IL market, this delta acts as a silent wealth tax, severely limiting their purchasing power and exacerbating the housing affordability crisis. Local policymakers must carefully evaluate these compounding costs against the reality of wage stagnation.
#33: Hidalgo County, TX, TX
Ranking 33th in our national property tax squeeze index is Hidalgo County, TX, located in the state of TX. Between 2009 and 2024, residents of this county experienced a median household income growth of 40.3%, starting from an estimated $61,538 and rising to $86,359. While on paper this represents significant wage growth, the true cost of homeownership paints a far more burdensome picture.
During that exact same 15-year period, the median property tax bill in Hidalgo County, TX surged by an astonishing 77.2%. In 2009, a typical homeowner paid roughly $2,957 annually. Today, that figure has skyrocketed to $5,238.
This creates a critical “Squeeze Delta” of 36.8%. What does this mean for the average family? It means that local municipal levies, driven by rising home assessments and shifting local budgets, have fundamentally outpaced the wage gains of the working class. When property taxes grow faster than income, homeowners are forced to allocate a larger percentage of their take-home pay to the government simply to remain in their homes. For new buyers entering the Hidalgo County, TX market, this delta acts as a silent wealth tax, severely limiting their purchasing power and exacerbating the housing affordability crisis. Local policymakers must carefully evaluate these compounding costs against the reality of wage stagnation.
#34: Ada County, ID, ID
Ranking 34th in our national property tax squeeze index is Ada County, ID, located in the state of ID. Between 2009 and 2024, residents of this county experienced a median household income growth of 30.4%, starting from an estimated $65,652 and rising to $85,608. While on paper this represents significant wage growth, the true cost of homeownership paints a far more burdensome picture.
During that exact same 15-year period, the median property tax bill in Ada County, ID surged by an astonishing 66.3%. In 2009, a typical homeowner paid roughly $2,465 annually. Today, that figure has skyrocketed to $4,100.
This creates a critical “Squeeze Delta” of 35.9%. What does this mean for the average family? It means that local municipal levies, driven by rising home assessments and shifting local budgets, have fundamentally outpaced the wage gains of the working class. When property taxes grow faster than income, homeowners are forced to allocate a larger percentage of their take-home pay to the government simply to remain in their homes. For new buyers entering the Ada County, ID market, this delta acts as a silent wealth tax, severely limiting their purchasing power and exacerbating the housing affordability crisis. Local policymakers must carefully evaluate these compounding costs against the reality of wage stagnation.
#35: Will County, IL, IL
Ranking 35th in our national property tax squeeze index is Will County, IL, located in the state of IL. Between 2009 and 2024, residents of this county experienced a median household income growth of 30.8%, starting from an estimated $60,305 and rising to $78,887. While on paper this represents significant wage growth, the true cost of homeownership paints a far more burdensome picture.
During that exact same 15-year period, the median property tax bill in Will County, IL surged by an astonishing 66.7%. In 2009, a typical homeowner paid roughly $3,933 annually. Today, that figure has skyrocketed to $6,557.
This creates a critical “Squeeze Delta” of 35.9%. What does this mean for the average family? It means that local municipal levies, driven by rising home assessments and shifting local budgets, have fundamentally outpaced the wage gains of the working class. When property taxes grow faster than income, homeowners are forced to allocate a larger percentage of their take-home pay to the government simply to remain in their homes. For new buyers entering the Will County, IL market, this delta acts as a silent wealth tax, severely limiting their purchasing power and exacerbating the housing affordability crisis. Local policymakers must carefully evaluate these compounding costs against the reality of wage stagnation.
#36: Hillsborough County, FL, FL
Ranking 36th in our national property tax squeeze index is Hillsborough County, FL, located in the state of FL. Between 2009 and 2024, residents of this county experienced a median household income growth of 58.3%, starting from an estimated $63,047 and rising to $99,778. While on paper this represents significant wage growth, the true cost of homeownership paints a far more burdensome picture.
During that exact same 15-year period, the median property tax bill in Hillsborough County, FL surged by an astonishing 93.8%. In 2009, a typical homeowner paid roughly $4,532 annually. Today, that figure has skyrocketed to $8,781.
This creates a critical “Squeeze Delta” of 35.5%. What does this mean for the average family? It means that local municipal levies, driven by rising home assessments and shifting local budgets, have fundamentally outpaced the wage gains of the working class. When property taxes grow faster than income, homeowners are forced to allocate a larger percentage of their take-home pay to the government simply to remain in their homes. For new buyers entering the Hillsborough County, FL market, this delta acts as a silent wealth tax, severely limiting their purchasing power and exacerbating the housing affordability crisis. Local policymakers must carefully evaluate these compounding costs against the reality of wage stagnation.
#37: Camden County, NJ, NJ
Ranking 37th in our national property tax squeeze index is Camden County, NJ, located in the state of NJ. Between 2009 and 2024, residents of this county experienced a median household income growth of 56.3%, starting from an estimated $66,972 and rising to $104,699. While on paper this represents significant wage growth, the true cost of homeownership paints a far more burdensome picture.
During that exact same 15-year period, the median property tax bill in Camden County, NJ surged by an astonishing 90.9%. In 2009, a typical homeowner paid roughly $5,691 annually. Today, that figure has skyrocketed to $10,863.
This creates a critical “Squeeze Delta” of 34.6%. What does this mean for the average family? It means that local municipal levies, driven by rising home assessments and shifting local budgets, have fundamentally outpaced the wage gains of the working class. When property taxes grow faster than income, homeowners are forced to allocate a larger percentage of their take-home pay to the government simply to remain in their homes. For new buyers entering the Camden County, NJ market, this delta acts as a silent wealth tax, severely limiting their purchasing power and exacerbating the housing affordability crisis. Local policymakers must carefully evaluate these compounding costs against the reality of wage stagnation.
#38: Fort Bend County, TX, TX
Ranking 38th in our national property tax squeeze index is Fort Bend County, TX, located in the state of TX. Between 2009 and 2024, residents of this county experienced a median household income growth of 57.8%, starting from an estimated $71,258 and rising to $112,467. While on paper this represents significant wage growth, the true cost of homeownership paints a far more burdensome picture.
During that exact same 15-year period, the median property tax bill in Fort Bend County, TX surged by an astonishing 91.8%. In 2009, a typical homeowner paid roughly $2,507 annually. Today, that figure has skyrocketed to $4,807.
This creates a critical “Squeeze Delta” of 33.9%. What does this mean for the average family? It means that local municipal levies, driven by rising home assessments and shifting local budgets, have fundamentally outpaced the wage gains of the working class. When property taxes grow faster than income, homeowners are forced to allocate a larger percentage of their take-home pay to the government simply to remain in their homes. For new buyers entering the Fort Bend County, TX market, this delta acts as a silent wealth tax, severely limiting their purchasing power and exacerbating the housing affordability crisis. Local policymakers must carefully evaluate these compounding costs against the reality of wage stagnation.
#39: King County, WA, WA
Ranking 39th in our national property tax squeeze index is King County, WA, located in the state of WA. Between 2009 and 2024, residents of this county experienced a median household income growth of 62.3%, starting from an estimated $77,606 and rising to $125,927. While on paper this represents significant wage growth, the true cost of homeownership paints a far more burdensome picture.
During that exact same 15-year period, the median property tax bill in King County, WA surged by an astonishing 94.5%. In 2009, a typical homeowner paid roughly $1,519 annually. Today, that figure has skyrocketed to $2,954.
This creates a critical “Squeeze Delta” of 32.3%. What does this mean for the average family? It means that local municipal levies, driven by rising home assessments and shifting local budgets, have fundamentally outpaced the wage gains of the working class. When property taxes grow faster than income, homeowners are forced to allocate a larger percentage of their take-home pay to the government simply to remain in their homes. For new buyers entering the King County, WA market, this delta acts as a silent wealth tax, severely limiting their purchasing power and exacerbating the housing affordability crisis. Local policymakers must carefully evaluate these compounding costs against the reality of wage stagnation.
#40: Nassau County, NY, NY
Ranking 40th in our national property tax squeeze index is Nassau County, NY, located in the state of NY. Between 2009 and 2024, residents of this county experienced a median household income growth of 44.9%, starting from an estimated $46,306 and rising to $67,119. While on paper this represents significant wage growth, the true cost of homeownership paints a far more burdensome picture.
During that exact same 15-year period, the median property tax bill in Nassau County, NY surged by an astonishing 75.3%. In 2009, a typical homeowner paid roughly $4,175 annually. Today, that figure has skyrocketed to $7,318.
This creates a critical “Squeeze Delta” of 30.3%. What does this mean for the average family? It means that local municipal levies, driven by rising home assessments and shifting local budgets, have fundamentally outpaced the wage gains of the working class. When property taxes grow faster than income, homeowners are forced to allocate a larger percentage of their take-home pay to the government simply to remain in their homes. For new buyers entering the Nassau County, NY market, this delta acts as a silent wealth tax, severely limiting their purchasing power and exacerbating the housing affordability crisis. Local policymakers must carefully evaluate these compounding costs against the reality of wage stagnation.
#41: Harris County, TX, TX
Ranking 41th in our national property tax squeeze index is Harris County, TX, located in the state of TX. Between 2009 and 2024, residents of this county experienced a median household income growth of 32.0%, starting from an estimated $46,685 and rising to $61,612. While on paper this represents significant wage growth, the true cost of homeownership paints a far more burdensome picture.
During that exact same 15-year period, the median property tax bill in Harris County, TX surged by an astonishing 62.0%. In 2009, a typical homeowner paid roughly $3,972 annually. Today, that figure has skyrocketed to $6,435.
This creates a critical “Squeeze Delta” of 30.0%. What does this mean for the average family? It means that local municipal levies, driven by rising home assessments and shifting local budgets, have fundamentally outpaced the wage gains of the working class. When property taxes grow faster than income, homeowners are forced to allocate a larger percentage of their take-home pay to the government simply to remain in their homes. For new buyers entering the Harris County, TX market, this delta acts as a silent wealth tax, severely limiting their purchasing power and exacerbating the housing affordability crisis. Local policymakers must carefully evaluate these compounding costs against the reality of wage stagnation.
#42: Johnson County, KS, KS
Ranking 42th in our national property tax squeeze index is Johnson County, KS, located in the state of KS. Between 2009 and 2024, residents of this county experienced a median household income growth of 43.1%, starting from an estimated $73,295 and rising to $104,884. While on paper this represents significant wage growth, the true cost of homeownership paints a far more burdensome picture.
During that exact same 15-year period, the median property tax bill in Johnson County, KS surged by an astonishing 71.0%. In 2009, a typical homeowner paid roughly $3,753 annually. Today, that figure has skyrocketed to $6,417.
This creates a critical “Squeeze Delta” of 27.9%. What does this mean for the average family? It means that local municipal levies, driven by rising home assessments and shifting local budgets, have fundamentally outpaced the wage gains of the working class. When property taxes grow faster than income, homeowners are forced to allocate a larger percentage of their take-home pay to the government simply to remain in their homes. For new buyers entering the Johnson County, KS market, this delta acts as a silent wealth tax, severely limiting their purchasing power and exacerbating the housing affordability crisis. Local policymakers must carefully evaluate these compounding costs against the reality of wage stagnation.
#43: Shelby County, TN, TN
Ranking 43th in our national property tax squeeze index is Shelby County, TN, located in the state of TN. Between 2009 and 2024, residents of this county experienced a median household income growth of 50.6%, starting from an estimated $51,893 and rising to $78,174. While on paper this represents significant wage growth, the true cost of homeownership paints a far more burdensome picture.
During that exact same 15-year period, the median property tax bill in Shelby County, TN surged by an astonishing 76.9%. In 2009, a typical homeowner paid roughly $4,430 annually. Today, that figure has skyrocketed to $7,836.
This creates a critical “Squeeze Delta” of 26.2%. What does this mean for the average family? It means that local municipal levies, driven by rising home assessments and shifting local budgets, have fundamentally outpaced the wage gains of the working class. When property taxes grow faster than income, homeowners are forced to allocate a larger percentage of their take-home pay to the government simply to remain in their homes. For new buyers entering the Shelby County, TN market, this delta acts as a silent wealth tax, severely limiting their purchasing power and exacerbating the housing affordability crisis. Local policymakers must carefully evaluate these compounding costs against the reality of wage stagnation.
#44: Montgomery County, MD, MD
Ranking 44th in our national property tax squeeze index is Montgomery County, MD, located in the state of MD. Between 2009 and 2024, residents of this county experienced a median household income growth of 48.5%, starting from an estimated $61,371 and rising to $91,159. While on paper this represents significant wage growth, the true cost of homeownership paints a far more burdensome picture.
During that exact same 15-year period, the median property tax bill in Montgomery County, MD surged by an astonishing 74.4%. In 2009, a typical homeowner paid roughly $1,621 annually. Today, that figure has skyrocketed to $2,827.
This creates a critical “Squeeze Delta” of 25.9%. What does this mean for the average family? It means that local municipal levies, driven by rising home assessments and shifting local budgets, have fundamentally outpaced the wage gains of the working class. When property taxes grow faster than income, homeowners are forced to allocate a larger percentage of their take-home pay to the government simply to remain in their homes. For new buyers entering the Montgomery County, MD market, this delta acts as a silent wealth tax, severely limiting their purchasing power and exacerbating the housing affordability crisis. Local policymakers must carefully evaluate these compounding costs against the reality of wage stagnation.
#45: Knox County, TN, TN
Ranking 45th in our national property tax squeeze index is Knox County, TN, located in the state of TN. Between 2009 and 2024, residents of this county experienced a median household income growth of 30.4%, starting from an estimated $47,105 and rising to $61,436. While on paper this represents significant wage growth, the true cost of homeownership paints a far more burdensome picture.
During that exact same 15-year period, the median property tax bill in Knox County, TN surged by an astonishing 56.1%. In 2009, a typical homeowner paid roughly $2,972 annually. Today, that figure has skyrocketed to $4,638.
This creates a critical “Squeeze Delta” of 25.6%. What does this mean for the average family? It means that local municipal levies, driven by rising home assessments and shifting local budgets, have fundamentally outpaced the wage gains of the working class. When property taxes grow faster than income, homeowners are forced to allocate a larger percentage of their take-home pay to the government simply to remain in their homes. For new buyers entering the Knox County, TN market, this delta acts as a silent wealth tax, severely limiting their purchasing power and exacerbating the housing affordability crisis. Local policymakers must carefully evaluate these compounding costs against the reality of wage stagnation.
#46: Milwaukee County, WI, WI
Ranking 46th in our national property tax squeeze index is Milwaukee County, WI, located in the state of WI. Between 2009 and 2024, residents of this county experienced a median household income growth of 64.8%, starting from an estimated $53,208 and rising to $87,691. While on paper this represents significant wage growth, the true cost of homeownership paints a far more burdensome picture.
During that exact same 15-year period, the median property tax bill in Milwaukee County, WI surged by an astonishing 90.1%. In 2009, a typical homeowner paid roughly $2,343 annually. Today, that figure has skyrocketed to $4,455.
This creates a critical “Squeeze Delta” of 25.3%. What does this mean for the average family? It means that local municipal levies, driven by rising home assessments and shifting local budgets, have fundamentally outpaced the wage gains of the working class. When property taxes grow faster than income, homeowners are forced to allocate a larger percentage of their take-home pay to the government simply to remain in their homes. For new buyers entering the Milwaukee County, WI market, this delta acts as a silent wealth tax, severely limiting their purchasing power and exacerbating the housing affordability crisis. Local policymakers must carefully evaluate these compounding costs against the reality of wage stagnation.
#47: Bucks County, PA, PA
Ranking 47th in our national property tax squeeze index is Bucks County, PA, located in the state of PA. Between 2009 and 2024, residents of this county experienced a median household income growth of 33.5%, starting from an estimated $45,698 and rising to $61,006. While on paper this represents significant wage growth, the true cost of homeownership paints a far more burdensome picture.
During that exact same 15-year period, the median property tax bill in Bucks County, PA surged by an astonishing 57.4%. In 2009, a typical homeowner paid roughly $1,225 annually. Today, that figure has skyrocketed to $1,927.
This creates a critical “Squeeze Delta” of 23.9%. What does this mean for the average family? It means that local municipal levies, driven by rising home assessments and shifting local budgets, have fundamentally outpaced the wage gains of the working class. When property taxes grow faster than income, homeowners are forced to allocate a larger percentage of their take-home pay to the government simply to remain in their homes. For new buyers entering the Bucks County, PA market, this delta acts as a silent wealth tax, severely limiting their purchasing power and exacerbating the housing affordability crisis. Local policymakers must carefully evaluate these compounding costs against the reality of wage stagnation.
#48: Kent County, MI, MI
Ranking 48th in our national property tax squeeze index is Kent County, MI, located in the state of MI. Between 2009 and 2024, residents of this county experienced a median household income growth of 33.6%, starting from an estimated $47,914 and rising to $64,017. While on paper this represents significant wage growth, the true cost of homeownership paints a far more burdensome picture.
During that exact same 15-year period, the median property tax bill in Kent County, MI surged by an astonishing 56.7%. In 2009, a typical homeowner paid roughly $3,877 annually. Today, that figure has skyrocketed to $6,074.
This creates a critical “Squeeze Delta” of 23.1%. What does this mean for the average family? It means that local municipal levies, driven by rising home assessments and shifting local budgets, have fundamentally outpaced the wage gains of the working class. When property taxes grow faster than income, homeowners are forced to allocate a larger percentage of their take-home pay to the government simply to remain in their homes. For new buyers entering the Kent County, MI market, this delta acts as a silent wealth tax, severely limiting their purchasing power and exacerbating the housing affordability crisis. Local policymakers must carefully evaluate these compounding costs against the reality of wage stagnation.
#49: Fairfield County, CT, CT
Ranking 49th in our national property tax squeeze index is Fairfield County, CT, located in the state of CT. Between 2009 and 2024, residents of this county experienced a median household income growth of 50.7%, starting from an estimated $67,677 and rising to $101,975. While on paper this represents significant wage growth, the true cost of homeownership paints a far more burdensome picture.
During that exact same 15-year period, the median property tax bill in Fairfield County, CT surged by an astonishing 73.6%. In 2009, a typical homeowner paid roughly $977 annually. Today, that figure has skyrocketed to $1,695.
This creates a critical “Squeeze Delta” of 22.9%. What does this mean for the average family? It means that local municipal levies, driven by rising home assessments and shifting local budgets, have fundamentally outpaced the wage gains of the working class. When property taxes grow faster than income, homeowners are forced to allocate a larger percentage of their take-home pay to the government simply to remain in their homes. For new buyers entering the Fairfield County, CT market, this delta acts as a silent wealth tax, severely limiting their purchasing power and exacerbating the housing affordability crisis. Local policymakers must carefully evaluate these compounding costs against the reality of wage stagnation.
#50: Cuyahoga County, OH, OH
Ranking 50th in our national property tax squeeze index is Cuyahoga County, OH, located in the state of OH. Between 2009 and 2024, residents of this county experienced a median household income growth of 60.7%, starting from an estimated $66,918 and rising to $107,541. While on paper this represents significant wage growth, the true cost of homeownership paints a far more burdensome picture.
During that exact same 15-year period, the median property tax bill in Cuyahoga County, OH surged by an astonishing 83.4%. In 2009, a typical homeowner paid roughly $2,596 annually. Today, that figure has skyrocketed to $4,760.
This creates a critical “Squeeze Delta” of 22.7%. What does this mean for the average family? It means that local municipal levies, driven by rising home assessments and shifting local budgets, have fundamentally outpaced the wage gains of the working class. When property taxes grow faster than income, homeowners are forced to allocate a larger percentage of their take-home pay to the government simply to remain in their homes. For new buyers entering the Cuyahoga County, OH market, this delta acts as a silent wealth tax, severely limiting their purchasing power and exacerbating the housing affordability crisis. Local policymakers must carefully evaluate these compounding costs against the reality of wage stagnation.
The 15-Year Master Data Index
Use the table below to find your specific county. Local reporters and researchers can download the raw dataset using the button below.
Download Complete CSV DatasetMethodology & How to Cite
Sources: Data was sourced utilizing the US Census Bureau American Community Survey (ACS) 5-year estimates (2005-2009 through 2020-2024). Variables analyzed include Median Household Income and Median Real Estate Taxes Paid.
Citation: When citing this data, please link directly to this report using the following format: “According to a 2025 analysis of Census data by US Property Stats, [Your Stat].”