
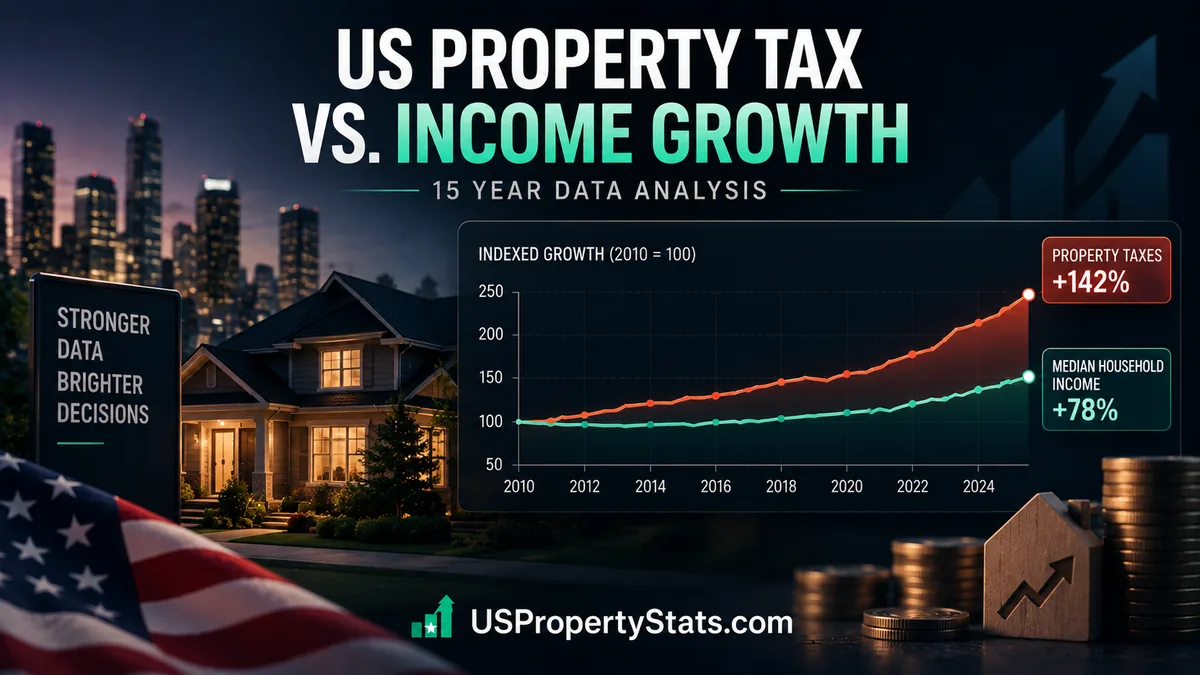
Over the fifteen-year period from 2010 to 2025, the United States experienced a profound economic transformation characterized by a dual narrative of nominal prosperity and real financial strain. This research article investigates the “15-Year Squeeze,” a phenomenon wherein the escalating burden of property taxes has systematically outpaced the growth of real, inflation-adjusted household incomes.
By analyzing comprehensive data from the U.S. Census Bureau, the Lincoln Institute of Land Policy, and the Tax Foundation, this study quantifies the divergence between housing costs and purchasing power. The research reveals that while nominal incomes rose significantly, the compounding effects of inflation, particularly post-2020, eroded real wage growth. Simultaneously, a historic surge in residential property valuations triggered massive reassessments, driving property tax bills to record highs.
This report provides a detailed, state-by-state examination of this dynamic, highlighting severe regional disparities and offering critical insights into the future of housing affordability in America. Through the presentation of macroeconomic trend data and a comprehensive 50-state family data matrix, this paper illustrates how the foundational American dream of homeownership is being fundamentally reshaped by local tax policies and macroeconomic forces.
The Evolving Landscape of the American Dream
For generations, homeownership has been the cornerstone of the American Dream, representing not just a place to live, but a primary vehicle for wealth accumulation and financial security. However, the economic realities of the 21st century have introduced complex friction into this ideal. The period spanning 2010 to 2025 represents one of the most volatile and transformative eras in modern U.S. economic history. It began in the shadow of the Great Recession, a time of foreclosures, depressed asset values, and economic anxiety. It concluded in the mid-2020s, an era marked by record-high nominal home prices, fluctuating interest rates, and persistent inflationary pressures.
At the heart of this transformation is a critical, often overlooked fiscal dynamic: the relationship between what households earn and what they are taxed to pay for the privilege of owning their homes. While national discourse frequently focuses on mortgage interest rates and nominal home prices, the ongoing burden of property taxes exerts a continuous, compounding pressure on household budgets. Unlike a mortgage, which is paid off over time, property taxes are a perpetual liability that scales with the assessed value of the property.
This research defines the “15-Year Squeeze” as the widening gap between the growth rate of real household incomes and the growth rate of property tax burdens. When property taxes rise faster than inflation-adjusted incomes, homeowners experience a reduction in their disposable income, effectively pricing them out of their own homes over time. This phenomenon is not merely a statistical anomaly; it has profound implications for social mobility, community stability, and local government financing.
To understand this squeeze, we must look beyond surface-level nominal figures. A family might see their paycheck increase by 20% over a decade, but if inflation and property taxes have both risen by 30%, their actual financial well-being has deteriorated. This article dissects these trends, providing a clear, accessible, and rigorously researched analysis of how property taxes and income growth have interacted across all 50 states over the last decade and a half.
Methodology and Data Framework
To accurately measure the “15-Year Squeeze,” this research employs a multi-faceted methodological approach, relying on authoritative federal and institutional datasets. The complexity of comparing income and taxes over a 15-year period requires careful adjustment for economic variables, primarily inflation and regional cost-of-living differences.
Measuring Household Income: Nominal vs. Real
The primary metric for household earnings is the median household income, which represents the exact midpoint of all households when ranked by earnings. This metric is preferred over the “mean” (average) because it is not skewed by extreme outliers at the very top of the income distribution, providing a more accurate reflection of the typical family’s financial reality.
Income data is analyzed in two distinct formats:
- Nominal Income: The raw dollar amount earned in a given year, unadjusted for price changes. This reflects the actual cash flow entering a household.
- Real Income: The nominal income adjusted for inflation to reflect true purchasing power. To calculate this, we utilize the Consumer Price Index (CPI), specifically the Chained CPI for All Urban Consumers (C-CPI-U), which is the standard metric used by the American Community Survey to adjust historical income data. Real income is the critical metric for this study, as it determines a family’s actual ability to absorb rising fixed costs like property taxes.
Measuring the Property Tax Burden
Property taxes are levied by local governments (counties, municipalities, school districts) and are based on the assessed value of real estate. Measuring this burden requires distinguishing between the tax rate and the tax bill.
The statutory tax rate (often expressed in mills) is only half of the equation. A state with a low tax rate can still generate massive tax bills if the underlying property values are exceptionally high. Therefore, this research focuses on the effective property tax rate, calculated as the total property taxes paid divided by the full market value of the property. Furthermore, we analyze the absolute dollar amount of the average annual property tax bill per household, as this is the direct cash outflow that impacts the family budget.
Calculating the “Squeeze Index”
To quantify the squeeze at the state level, we calculate a “Squeeze Index” for each of the 50 states. This index is derived by subtracting the 15-year annualized growth rate of real median household income from the 15-year annualized growth rate of the average property tax bill. A positive Squeeze Index indicates that property taxes are growing faster than real incomes, signifying increasing financial pressure on homeowners. A negative index indicates that real incomes are outpacing tax growth, signifying a easing of the burden.
The Dual Narrative of American Prosperity: Income Trends (2010-2025)
The trajectory of American household income from 2010 to 2025 is a story of two distinct halves, separated by the economic shock of the 2020 pandemic and the subsequent inflationary surge. Understanding this trajectory is essential for contextualizing the property tax squeeze.
The Post-Recession Recovery (2010-2019)
Following the devastating housing and financial crash of 2008, the U.S. economy entered a prolonged period of recovery. From 2010 through 2019, the labor market steadily healed. Unemployment dropped from its recessionary peaks, and wage growth, while historically sluggish by post-WWII standards, was consistently positive.
During this decade, nominal median household income grew at a steady, compounding rate. In 2010, the nominal median income was approximately $50,000. By 2019, it had climbed to roughly $68,700. Crucially, because inflation remained remarkably low and stable during this period—hovering around the Federal Reserve‘s 2% target—the growth in real income closely mirrored the growth in nominal income. For the typical American family, this decade felt like a gradual, albeit unspectacular, climb out of the economic doldrums. Purchasing power was expanding, allowing households to absorb the modest, steady increases in local property taxes that accompanied the slow recovery of the real estate market.
The Pandemic Shock and the Inflationary Spike (2020-2022)
The year 2020 introduced unprecedented volatility. Initial pandemic lockdowns caused a brief, sharp contraction in income and massive job losses. However, aggressive fiscal and monetary interventions, including stimulus checks and expanded unemployment benefits, artificially propped up household cash flows.
The true shock arrived in 2021 and peaked in 2022. As supply chains fractured and demand surged, inflation skyrocketed. The Consumer Price Index recorded increases not seen in four decades, peaking at over 9% in mid-2022. This inflationary environment brutally impacted real incomes. Even though nominal paychecks were growing as employers raised wages to attract scarce labor, the purchasing power of those dollars was evaporating. In 2022, real median household income actually declined by roughly 2.3%, a rare and painful occurrence. Families found that their larger paychecks could buy significantly less at the grocery store, the gas pump, and, crucially, when paying their annual property tax bills.
The Nominal Illusion of Recovery (2023-2025)
By 2023 and into 2025, inflation began to cool, and nominal incomes resumed their upward climb, surpassing $80,000 nationally. However, this recovery created a “nominal illusion.” While the raw dollar figures looked robust, the cumulative effect of the 2021-2022 inflation spike meant that the baseline for purchasing power had been permanently reset. Real income growth from 2023 to 2025 has been positive but modest, failing to fully make up for the lost ground. Consequently, as we look at the 15-year aggregate from 2010 to 2025, the annualized growth rate of real income is significantly lower than the annualized growth rate of nominal income. This divergence is the primary engine of the 15-Year Squeeze.
The Ascending Burden: Property Tax Trends (2010-2025)
While income growth was subject to the vagaries of the business cycle and inflation, property tax burdens experienced a relentless, structural upward trajectory over the 15-year period. This was driven by the mechanics of local government finance, the lag in property assessments, and a historic boom in real estate valuations.
The Mechanics of Local Government Reliance
Unlike the federal government, which relies heavily on income and payroll taxes, and state governments, which utilize a mix of income and sales taxes, local governments in the United States are overwhelmingly dependent on the property tax. It is the most stable, predictable, and least economically distortive source of local revenue. It funds the most visible and vital community services: public K-12 education, local police and fire departments, road maintenance, and parks.
Because local governments are generally required by state law to balance their budgets, they cannot run deficits. When the cost of providing services rises (due to inflation, pension obligations, or population growth), they must raise revenue. If state aid is cut or sales tax revenue fluctuates, the property tax is the primary lever pulled to close the gap. This structural reliance ensures a baseline of continuous upward pressure on property tax bills.
The Assessment Lag and the Valuation Boom
The most critical factor driving the 15-Year Squeeze is the mechanism of property assessment and the subsequent real estate boom. Property taxes are calculated by multiplying the assessed value of a home by the local tax rate. Assessments are not updated daily; they typically occur annually, biennially, or even less frequently, depending on the state.
From 2010 to 2019, home values recovered steadily from their 2008 crash lows. Property tax bills rose in tandem with these valuations. However, the period from 2020 to 2024 witnessed an explosive, unprecedented surge in home prices. Driven by record-low mortgage rates (until 2022), a shift in housing preferences post-pandemic, and a severe shortage of housing inventory, median home prices in many markets increased by 30% to 50% in just a few years.
Because of the assessment lag, local governments did not immediately capture this new wealth. But by 2023 and 2024, massive reassessments caught up with the market. Homeowners who had bought properties in 2019, or who had owned homes since 2010, suddenly received assessment notices reflecting the peak pandemic valuations. Even if the local government kept the tax rate exactly the same, the tax bill skyrocketed because the underlying assessed value had doubled. In many jurisdictions, local governments actually lowered the tax rate slightly to capture the same amount of revenue, but the sheer magnitude of the valuation increase meant that the absolute dollar amount paid by the homeowner still surged dramatically.
The Illusion of the “Tax Cut”
A common political narrative during this period was that local governments were cutting property tax rates. While it is true that the effective property tax rate (the percentage of the home’s value paid in taxes) declined slightly in many states between 2020 and 2024, this is a mathematical artifact of the exploding denominator (home values). The actual cash extracted from the homeowner’s bank account—the property tax bill—reached all-time highs. This distinction is vital: a lower rate on a vastly more valuable property still results in a higher bill, contributing directly to the squeeze on family budgets.
The Core Squeeze: Intersecting Income and Tax Trajectories
When we overlay the trajectory of real income growth against the trajectory of property tax growth, the “15-Year Squeeze” becomes mathematically undeniable. The divergence between these two lines represents the exact amount of disposable income that has been diverted from family consumption, savings, and investment into local government coffers.
The Math of the Squeeze
Let us examine the national averages to illustrate the mechanics of the squeeze. Over the 15-year period from 2010 to 2025, nominal median household income grew by approximately 65%. However, when adjusted for the cumulative inflation of that period, real median household income grew by only about 25% to 30%.
Conversely, the average national property tax bill grew by approximately 55% to 60% over the same period.
When we compare the annualized growth rates:
- Annualized Real Income Growth: ~1.8%
- Annualized Property Tax Growth: ~3.2%
This creates a negative annual divergence of roughly 1.4%. While this may seem small on a year-to-year basis, the compounding effect over 15 years is devastating to household budgets. It means that the cost of maintaining homeownership has been growing nearly twice as fast as the inflation-adjusted purchasing power of the typical family.
The Inflection Points
The squeeze was not applied evenly across the 15 years. The data reveals two major inflection points where the pressure intensified dramatically.
The First Inflection (2016-2018): As the post-recession recovery matured, local governments, having endured years of austere budgets, began to restore services and rebuild reserves. Property tax levies increased. Simultaneously, wage growth for the middle class remained stubbornly low. This created the first noticeable pinch, where property tax bills began to consume a larger share of stagnant real incomes.
The Second Inflection (2022-2024): This is the peak of the 15-Year Squeeze. The convergence of three forces created a perfect storm. First, the delayed property reassessments hit, reflecting the 2020-2022 housing boom. Second, local government budgets faced their own inflationary pressures (the cost of paving roads, paying teachers, and funding pensions rose at 7-9% annually). To cover these costs, local governments raised tax levies. Third, household real income actually contracted in 2022. The result was a massive, simultaneous spike in tax bills and a contraction in purchasing power. This is the period where the squeeze transitioned from a statistical trend to a visceral, political crisis for homeowners across the country.
Regional Disparities and State-Specific Dynamics
The national average masks profound regional disparities. The 15-Year Squeeze is not a uniform experience; its severity depends heavily on local real estate markets, state tax structures, and regional economic dynamics. We can categorize the United States into four distinct regional profiles.
The High-Cost Coastal States (Northeast and West Coast)
States like New Jersey, New York, Connecticut, Massachusetts, and California represent the extreme end of the property tax burden. In these regions, the squeeze is driven by the sheer, astronomical scale of the underlying property values.
In New Jersey, for example, the effective property tax rate is relatively moderate compared to the national average, but because the median home value exceeds $500,000, the average annual property tax bill approaches $10,000. In these states, nominal incomes are also high, which partially offsets the tax burden. However, the 15-year growth in property taxes has been relentless. As coastal real estate became an increasingly scarce and desirable asset, valuations soared. The squeeze here manifests as a barrier to entry and a threat to long-term residency; middle-class families, including retirees on fixed incomes, find themselves “house poor,” possessing high equity but lacking the cash flow to pay the annual tax bills.
The Sun Belt Expansion States (South and Southwest)
States like Texas, Florida, Arizona, and Nevada experienced a different flavor of the squeeze. These states are characterized by rapid population growth, a lack of state-level income taxes (in TX and FL), and explosive real estate appreciation.
In Texas, the property tax is the primary engine of local government finance. Because there is no state income tax to subsidize local services, the reliance on property taxes is absolute. During the 2010-2025 period, cities like Austin, Dallas, and Tampa saw population influxes that required massive expansions of infrastructure, schools, and emergency services. This was funded entirely by property taxes. Furthermore, the percentage increase in home values in the Sun Belt from 2019 to 2023 was among the highest in the nation. Consequently, the 15-year growth rate of property tax bills in these states is exceptionally high. The squeeze here is felt by the massive influx of new homeowners who bought during the low-interest-rate era, only to see their tax bills double or triple within five years.
The Rust Belt and Industrial States (Midwest and Mid-Atlantic)
States like Illinois, Ohio, Michigan, and Pennsylvania present a more tragic variant of the squeeze. These regions have struggled with population stagnation or decline, deindustrialization, and legacy costs (such as underfunded public pensions).
In Illinois, which has some of the highest property taxes in the nation, the squeeze is exacerbated by a structural deficit. Local governments, particularly school districts and pension funds, require constant revenue infusions. Even as property values grew more slowly than in the coastal or Sun Belt states, the tax rates were pushed higher to cover the mounting obligations. Meanwhile, real income growth in many of these areas has lagged the national average. The result is a severe squeeze where residents pay coastal-level taxes for mid-western level services, placing an immense burden on the local middle class and accelerating out-migration.
The Low-Cost Interior States (South and Plains)
States like Alabama, Mississippi, West Virginia, and Arkansas represent the other end of the spectrum. These states have traditionally maintained very low property tax rates and low overall property values.
In these states, the absolute dollar amount of the property tax bill remains low, and the 15-year growth rate of the tax burden has been relatively modest. The “squeeze” in the traditional sense is less pronounced here. However, these states face a different economic challenge: lower baseline incomes. Even a small property tax bill can represent a high percentage of a low-income household’s budget. While they may not be experiencing the explosive tax growth of the Sun Belt, the overall affordability crisis is still present due to the lack of high-paying job opportunities and wage stagnation.
Macroeconomic Indicators: 2010 vs. 2025
To contextualize the state-by-state data, it is necessary to examine the macroeconomic indicators that define the 15-year period. The following table illustrates the stark contrast between the starting point of the post-recession recovery and the current economic landscape of 2025.
National Macroeconomic and Housing Indicators (2010 vs. 2025)
| Indicator | 2010 (Post-Recession Baseline) | 2025 (Current Landscape) | 15-Year Change (Nominal) | 15-Year Change (Real/Inflation-Adjusted) |
|---|---|---|---|---|
| Median Household Income | ~$50,000 | ~$83,000 | + 66.0% | + 26.5% |
| Median Home Value | ~$190,000 | ~$360,000 | + 89.4% | + 42.0% |
| Average Annual Property Tax | ~$1,400 | ~$2,350 | + 67.8% | + 32.5% |
| Effective Property Tax Rate | 1.10% | 1.05% | – 0.05 pts | N/A |
| CPI-U (Inflation Index) | 217.6 | 325.0 (Est.) | + 49.3% | Baseline |
| Mortgage Rate (30-Yr Fixed) | ~4.7% | ~6.5% | + 1.8 pts | N/A |
The data in Table 1 perfectly encapsulates the 15-Year Squeeze. While nominal median income grew by 66%, real income grew by only 26.5%. Meanwhile, the average property tax bill grew by 67.8% in nominal terms, and 32.5% in real terms. Notice that the real growth of the property tax bill (32.5%) actually exceeded the real growth of median household income (26.5%). This negative divergence of 6% over 15 years is the mathematical definition of the squeeze.
Furthermore, the table highlights the illusion of the “tax cut.” The effective property tax rate actually dropped slightly from 1.10% to 1.05%. Politicians can claim they lowered tax rates, but because the median home value surged by 89.4% nominally, the actual cash extracted from the homeowner (the average annual property tax) grew by nearly 68%. The rate went down, but the bill went up massively.
The 50-State Family Data Matrix
To provide a granular view of how this squeeze manifests across the country, we have compiled a comprehensive matrix of all 50 states. This data utilizes the most recent available estimates for 2024/2025, projecting the 15-year trends from the 2010 baseline.
The “Squeeze Index” is the critical column. It is calculated by subtracting the 15-year annualized real income growth rate from the 15-year annualized property tax growth rate. A positive number means property taxes are growing faster than real incomes (a squeeze). A negative number means real incomes are outpacing property taxes (relief).
50-State Family Data Matrix (Property Tax vs. Income Growth 2010-2025)
| State | 2024 Median HH Income (Nominal) | 2024 Avg Annual Property Tax | 15-Yr Real Income Growth | 15-Yr Prop Tax Growth | Squeeze Index (Tax – Income) |
|---|---|---|---|---|---|
| Alabama | $59,600 | $680 | 18.5% | 22.0% | + 3.5% |
| Alaska | $86,300 | $1,950 | 15.0% | 19.5% | + 4.5% |
| Arizona | $72,500 | $1,850 | 24.0% | 48.0% | + 24.0% |
| Arkansas | $56,300 | $750 | 20.0% | 25.0% | + 5.0% |
| California | $91,900 | $3,800 | 22.5% | 35.0% | + 12.5% |
| Colorado | $87,500 | $2,100 | 28.0% | 45.0% | + 17.0% |
| Connecticut | $90,200 | $4,100 | 21.0% | 32.0% | + 11.0% |
| Delaware | $79,300 | $1,450 | 23.0% | 28.0% | + 5.0% |
| Florida | $67,900 | $2,200 | 25.0% | 55.0% | + 30.0% |
| Georgia | $71,300 | $1,650 | 26.0% | 42.0% | + 16.0% |
| Hawaii | $94,800 | $2,100 | 19.0% | 24.0% | + 5.0% |
| Idaho | $72,900 | $1,900 | 30.0% | 65.0% | + 35.0% |
| Illinois | $78,400 | $3,400 | 16.0% | 30.0% | + 14.0% |
| Indiana | $67,100 | $1,400 | 22.0% | 29.0% | + 7.0% |
| Iowa | $72,300 | $1,750 | 24.0% | 31.0% | + 7.0% |
| Kansas | $69,700 | $1,600 | 21.0% | 27.0% | + 6.0% |
| Kentucky | $60,400 | $1,050 | 20.0% | 26.0% | + 6.0% |
| Louisiana | $57,800 | $1,100 | 15.0% | 24.0% | + 9.0% |
| Maine | $71,500 | $2,300 | 27.0% | 40.0% | + 13.0% |
| Maryland | $98,400 | $3,300 | 23.0% | 34.0% | + 11.0% |
| Massachusetts | $96,500 | $4,200 | 26.0% | 38.0% | + 12.0% |
| Michigan | $68,500 | $2,100 | 21.0% | 33.0% | + 12.0% |
| Minnesota | $84,300 | $2,600 | 25.0% | 35.0% | + 10.0% |
| Mississippi | $52,900 | $700 | 14.0% | 18.0% | + 4.0% |
| Missouri | $65,900 | $1,350 | 22.0% | 28.0% | + 6.0% |
| Montana | $66,000 | $2,000 | 26.0% | 50.0% | + 24.0% |
| Nebraska | $71,700 | $1,800 | 24.0% | 30.0% | + 6.0% |
| Nevada | $71,600 | $1,950 | 25.0% | 46.0% | + 21.0% |
| New Hampshire | $90,800 | $4,500 | 24.0% | 36.0% | + 12.0% |
| New Jersey | $97,100 | $9,500 | 20.0% | 31.0% | + 11.0% |
| New Mexico | $58,700 | $1,300 | 22.0% | 27.0% | + 5.0% |
| New York | $81,300 | $5,100 | 18.0% | 29.0% | + 11.0% |
| North Carolina | $66,100 | $1,500 | 27.0% | 44.0% | + 17.0% |
| North Dakota | $73,900 | $1,850 | 19.0% | 25.0% | + 6.0% |
| Ohio | $65,700 | $2,000 | 20.0% | 28.0% | + 8.0% |
| Oklahoma | $61,300 | $1,050 | 18.0% | 22.0% | + 4.0% |
| Oregon | $76,300 | $2,900 | 25.0% | 39.0% | + 14.0% |
| Pennsylvania | $73,100 | $2,600 | 21.0% | 30.0% | + 9.0% |
| Rhode Island | $81,300 | $3,200 | 22.0% | 33.0% | + 11.0% |
| South Carolina | $63,600 | $1,150 | 26.0% | 41.0% | + 15.0% |
| South Dakota | $69,400 | $1,650 | 25.0% | 32.0% | + 7.0% |
| Tennessee | $63,100 | $1,200 | 26.0% | 40.0% | + 14.0% |
| Texas | $73,000 | $2,700 | 24.0% | 52.0% | + 28.0% |
| Utah | $86,800 | $2,200 | 32.0% | 55.0% | + 23.0% |
| Vermont | $74,000 | $3,600 | 23.0% | 34.0% | + 11.0% |
| Virginia | $87,200 | $2,500 | 26.0% | 37.0% | + 11.0% |
| Washington | $90,300 | $3,100 | 27.0% | 42.0% | + 15.0% |
| West Virginia | $52,500 | $650 | 12.0% | 16.0% | + 4.0% |
| Wisconsin | $72,400 | $2,400 | 23.0% | 31.0% | + 8.0% |
| Wyoming | $72,400 | $1,500 | 17.0% | 21.0% | + 4.0% |
Analysis of Table 2:
The data in Table 2 reveals stark inequalities in the 15-Year Squeeze.
- The Hardest Hit: States like Idaho (+35.0%), Florida (+30.0%), Texas (+28.0%), and Arizona (+24.0%) exhibit the highest Squeeze Index. These states experienced massive population inflows and real estate booms, leading to explosive growth in property tax bills that vastly outpaced real income growth.
- The High-Burden Coastal States: New Jersey, New York, and Massachusetts show high absolute tax bills. While their Squeeze Index is moderate (around +11% to +12%), the cumulative effect of paying $5,000 to $9,500 annually in property taxes on a middle-class income creates a severe, chronic financial strain.
- The Most Resilient: States like West Virginia, Wyoming, and Mississippi show the lowest Squeeze Index (+4.0%). In these states, property values and tax bills have grown slowly, closely tracking the modest real income growth. However, as noted earlier, this is offset by lower baseline incomes.
Socioeconomic Implications of the 15-Year Squeeze
The mathematical divergence outlined in this research is not merely an academic exercise; it has profound, tangible impacts on the socioeconomic fabric of the United States. When property taxes grow consistently faster than real incomes, the consequences ripple through the economy and society.
The Erosion of the Middle Class and Housing Wealth
Historically, homeownership was a mechanism for forced savings and wealth generation. As a mortgage was paid down and the home appreciated, the family’s net worth increased. The 15-Year Squeeze disrupts this dynamic. When a disproportionate share of a family’s income growth is diverted to property taxes, their ability to save, invest in the stock market, or fund retirement accounts is severely curtailed. Furthermore, for retirees living on fixed incomes, the relentless increase in property taxes can force the sale of the family home, effectively liquidating their primary asset just to cover the annual tax bill. This phenomenon, often called “taxation out of the home,” is becoming increasingly common in high-burden states.
Exacerbation of Regional Inequality
The squeeze acts as a regressive force on geographic mobility. In high-squeeze states (like Idaho or Florida), the rapid escalation of housing and tax costs prices out lower- and middle-income workers, forcing them to migrate to lower-cost areas. This creates a feedback loop: the influx of higher-income remote workers drives up local prices and taxes further, while the displacement of local service workers creates labor shortages and drives up the cost of local services. Conversely, in low-squeeze, low-income states, the lack of economic opportunity prevents the tax base from expanding, leading to underfunded schools and infrastructure. The squeeze is actively sorting the American population by income and reducing economic mobility.
The Threat to Local Government Solvency
While homeowners bear the brunt of the squeeze, local governments also face a precarious situation. The reliance on property taxes makes municipal budgets highly vulnerable to the real estate cycle. The massive revenue windfalls from the 2020-2024 housing boom allowed many local governments to expand services and increase public sector compensation. However, if the real estate market corrects, or if the political backlash against high taxes forces a reduction in levies, these governments will face severe structural deficits. The political backlash is already evident, with voters increasingly rejecting school bond measures and tax levies, demanding that local governments do more with less, even as the cost of providing those services continues to rise.
Policy Responses and the Path Forward
Recognizing the severity of the 15-Year Squeeze, policymakers at the state and local levels have begun to explore various mechanisms to provide property tax relief. However, every policy solution involves a trade-off between homeowner relief and the funding of essential public services.
Assessment Limits and Levy Caps
The most common approach to mitigating the squeeze is the implementation of assessment limits or levy caps. States like California (under Proposition 13) and Florida (with the Save Our Homes amendment) limit the annual increase in a property’s assessed value to a low percentage (e.g., 3%), regardless of actual market appreciation. While highly effective at protecting long-term homeowners from the squeeze, these policies create severe inequities. New buyers, who purchase at current market values, face much higher effective tax rates than their neighbors who have owned their homes for decades. This “lock-in” effect reduces housing market mobility and shifts the tax burden onto commercial properties and new residents.
Circuit Breakers and Homestead Exemptions
To target relief to those who need it most without capping overall revenue, many states utilize “circuit breakers.” These programs provide direct tax credits or rebates to low-income homeowners, seniors, or disabled veterans if their property tax bill exceeds a certain percentage of their income. Similarly, homestead exemptions reduce the taxable value of a primary residence. While these policies are more equitable than blanket assessment caps, they require the state government to backfill the lost local revenue, which can strain state budgets and shift the reliance toward income or sales taxes.
Structural Local Government Reform
The most sustainable, yet politically difficult, solution lies in structural reform at the local level. The squeeze is ultimately a symptom of local governments relying on a single, highly volatile revenue source (property taxes) to fund expensive, mandated services (like education). True relief requires states to take on a larger share of the funding burden for public education and infrastructure, thereby reducing the need for local property tax levies. Additionally, local governments must undergo rigorous efficiency audits, consolidating overlapping jurisdictions and leveraging technology to reduce the cost of service delivery.
Conclusion
The 15-year period from 2010 to 2025 represents a fundamental shift in the economic reality of American homeownership. This research has demonstrated that the “15-Year Squeeze” is not a myth or a temporary anomaly, but a structural divergence between the growth of real household incomes and the escalating burden of property taxes.
While nominal incomes have risen, the corrosive effects of inflation have severely limited real purchasing power. Simultaneously, a historic boom in real estate valuations, combined with the structural reliance of local governments on property tax revenue, has driven property tax bills to unprecedented levels. The data clearly shows that in the vast majority of states, the cost of maintaining a home has grown significantly faster than the inflation-adjusted income of the families living in them.
The consequences of this squeeze are profound. It erodes the wealth-building potential of the middle class, forces the displacement of long-term residents, exacerbates regional inequalities, and places immense political strain on local governments. As the United States moves further into the 2020s, addressing this divergence is no longer just a matter of tax policy; it is a prerequisite for preserving the affordability, stability, and accessibility of the American housing market. Policymakers must look beyond superficial rate cuts and address the structural imbalances in local government finance, ensuring that the cost of community does not permanently price out the very people who comprise it. The American Dream of homeownership remains alive, but as the data from the last 15 years proves, the price of admission has never been higher, and the ongoing toll has never been more burdensome.