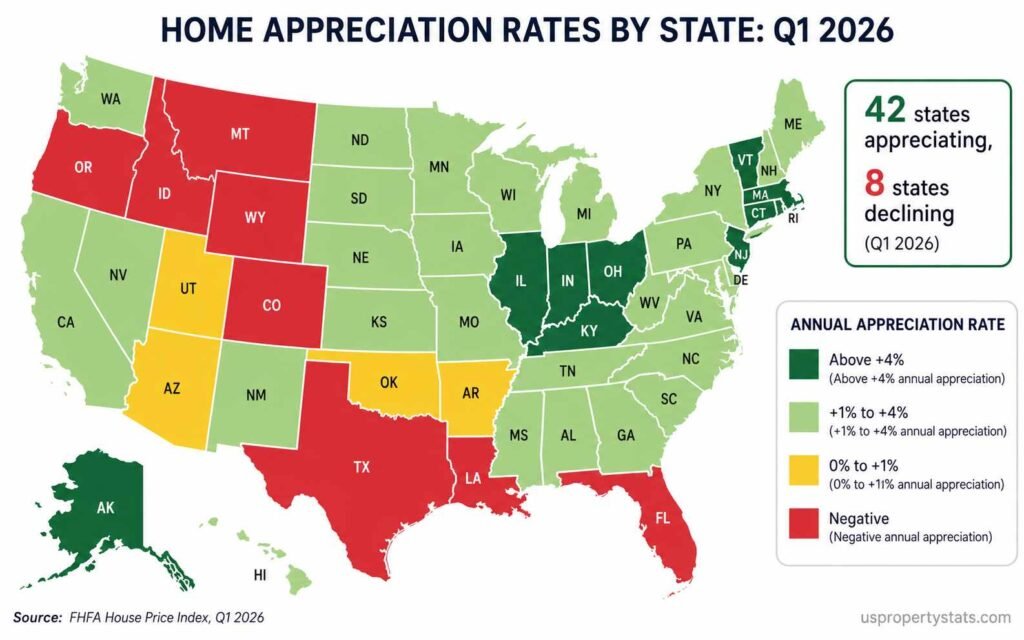
US home prices rose 1.7% year-over-year in Q1 2026, according to the FHFA House Price Index, marking the 57th consecutive quarter of positive national appreciation since Q1 2012. Appreciation rates ranged from +7.3% in Illinois to -2.4% in Colorado. Of the 50 states, 42 posted price gains, while 8 states and the District of Columbia declined.
This page presents home appreciation data across four time horizons: one year (Q1 2025 to Q1 2026), five years (Q1 2021 to Q1 2026), ten years (Q1 2016 to Q1 2026), and since 2000. All appreciation data is sourced from the FHFA House Price Index, the most comprehensive and publicly available measure of single-family home price changes, based on repeat-sales methodology across all 50 states. Supplemental data from Zillow ZHVI is noted where used. Updated quarterly.
| Metric | Value | Period | Prior Period |
|---|---|---|---|
| National 1-Year Appreciation (FHFA HPI) | +1.7% | Q1 2025 to Q1 2026 | +1.8% (Q4 2024 to Q4 2025) |
| Quarterly Change | +0.5% | Q4 2025 to Q1 2026 | +0.8% prior quarter |
| Monthly Change (March) | +0.1% | February to March 2026 | +0.3% (revised, Dec 2025) |
| States With Positive Appreciation | 42 of 50 | Q1 2026 | 41 of 50 (Q4 2025) |
| States With Price Declines | 8 states + DC | Q1 2026 | 9 states + DC (Q4 2025) |
| Highest State (1-Year) | Illinois +7.3% | Q1 2026 | North Dakota +6.4% (Q4 2025) |
| Largest Decline (1-Year) | Colorado -2.4% | Q1 2026 | Florida -2.7% (Q4 2025) |
| Strongest Metro (1-Year) | Elgin, IL +10.8% | Q1 2026 | Allentown, PA +8.9% (Q4 2025) |
| Weakest Metro (1-Year) | Austin, TX -6.9% | Q1 2026 | Cape Coral, FL -9.1% (Q4 2025) |
| Consecutive Quarters of National Gains | 57 quarters | Since Q1 2012 | N/A |
The national +1.7% annual rate is the slowest pace of appreciation since Q1 2012, the first quarter of the post-crisis recovery. The deceleration is not a new development: annual appreciation peaked at approximately 19% in early 2022, then declined steadily to 8% in 2023, 4.5% in 2024, and now 1.7% in Q1 2026. The US has experienced 57 consecutive quarters of positive national price appreciation, a streak that began immediately after the housing crisis bottom in Q1 2012 and has persisted through multiple rate cycles.
Home Appreciation Rates by State: 1-Year Ranking (Q1 2026)
| # | State | 1-Year Change (Q1 2026) | Census Division |
|---|---|---|---|
| 1 | Illinois | +7.3% | East North Central |
| 2 | Alaska | +5.5% | Pacific |
| 3 | Vermont | +4.9% | New England |
| 4 | Connecticut | +4.7% | New England |
| 5 | Kentucky | +4.7% | East South Central |
| 6 | New Jersey | +4.5% | Mid-Atlantic |
| 7 | Massachusetts | +4.4% | New England |
| 8 | Indiana | +4.3% | East North Central |
| 9 | Ohio | +4.2% | East North Central |
| 10 | Rhode Island | +4.1% | New England |
| 11 | Michigan | +3.9% | East North Central |
| 12 | Pennsylvania | +3.8% | Mid-Atlantic |
| 13 | New Hampshire | +3.7% | New England |
| 14 | Wisconsin | +3.6% | East North Central |
| 15 | Maine | +3.5% | New England |
| 16 | Delaware | +3.4% | South Atlantic |
| 17 | Maryland | +3.3% | South Atlantic |
| 18 | Minnesota | +3.2% | West North Central |
| 19 | West Virginia | +3.1% | South Atlantic |
| 20 | Missouri | +3.0% | West North Central |
| 21 | Virginia | +2.9% | South Atlantic |
| 22 | Iowa | +2.8% | West North Central |
| 23 | South Dakota | +2.7% | West North Central |
| 24 | Kansas | +2.6% | West North Central |
| 25 | Nebraska | +2.5% | West North Central |
| 26 | New York | +2.4% | Mid-Atlantic |
| 27 | North Dakota | +2.3% | West North Central |
| 28 | Alabama | +2.2% | East South Central |
| 29 | Mississippi | +2.1% | East South Central |
| 30 | Hawaii | +2.1% | Pacific |
| 31 | North Carolina | +2.0% | South Atlantic |
| 32 | South Carolina | +1.9% | South Atlantic |
| 33 | New Mexico | +1.8% | Mountain |
| 34 | Tennessee | +1.7% | East South Central |
| 35 | Georgia | +1.5% | South Atlantic |
| 36 | Nevada | +1.4% | Mountain |
| 37 | California | +1.2% | Pacific |
| 38 | Washington | +1.1% | Pacific |
| 39 | Arkansas | +0.8% | West South Central |
| 40 | Oklahoma | +0.4% | West South Central |
| 41 | Arizona | +0.2% | Mountain |
| 42 | Utah | -0.1% | Mountain |
| 43 | Florida | -0.8% | South Atlantic |
| 44 | Wyoming | -0.9% | Mountain |
| 45 | Oregon | -1.1% | Pacific |
| 46 | Texas | -1.3% | West South Central |
| 47 | Montana | -1.5% | Mountain |
| 48 | Idaho | -1.8% | Mountain |
| 49 | Louisiana | -2.1% | West South Central |
| 50 | Colorado | -2.4% | Mountain |
| N/A | District of Columbia | -1.9% | South Atlantic |
The state-level ranking confirms a clear geographic pattern. The top 15 appreciating states are concentrated in the Northeast (New England + Mid-Atlantic) and Midwest (East North Central), the two census divisions with the most severe inventory shortages relative to pre-pandemic norms. Illinois leads nationally at +7.3%, driven by Elgin’s +10.8% metro gain, the strongest appreciation of any of the 100 largest metros tracked by FHFA in Q1 2026.
The 8 states with declining prices share structural characteristics. Colorado (-2.4%), Idaho (-1.8%), Montana (-1.5%), and Oregon (-1.1%) are Mountain West states that saw the sharpest pandemic-era appreciation and are now correcting as inventory has normalised or exceeded pre-pandemic levels. Texas (-1.3%) and Louisiana (-2.1%) are in the West South Central census division, the only division to post a negative annual change (-0.7%) in Q1 2026. Florida (-0.8%) is driven by the combined pressure of rising insurance costs following 2024’s back-to-back hurricanes, new construction supply, and affordability exhaustion in pandemic boomtowns. Cape Coral-Fort Myers was the weakest major metro in Q4 2025 at -9.1%.
For current price levels alongside these appreciation rates, see Median Home Price in the US. For market-level context on which states have the tightest inventory, see US Housing Inventory.
Census Division Appreciation Rates
| Census Division | States Included | 1-Year Change (Q1 2026) | Monthly Change (March 2026) |
|---|---|---|---|
| East North Central | IL, IN, MI, OH, WI | +4.4% | N/A |
| East South Central | AL, KY, MS, TN | +3.2% (est.) | +1.7% |
| New England | CT, MA, ME, NH, RI, VT | +3.0% (est.) | N/A |
| Mid-Atlantic | NJ, NY, PA | +2.8% (est.) | N/A |
| West North Central | IA, KS, MN, MO, ND, NE, SD | +2.5% (est.) | N/A |
| South Atlantic | DC, DE, FL, GA, MD, NC, SC, VA, WV | +1.2% (est.) | N/A |
| Mountain | AZ, CO, ID, MT, NM, NV, UT, WY | -0.4% (est.) | N/A |
| Pacific | AK, CA, HI, OR, WA | +1.0% (est.) | N/A |
| West South Central | AR, LA, OK, TX | -0.7% | -0.7% |
The East North Central division’s +4.4% gain is more than six times the West South Central division’s -0.7% decline, quantifying the geographic divergence. The two divisions represent opposite ends of the inventory spectrum. Mortgage News Daily’s analysis of the Q1 2026 report notes that “seven of the nine census divisions posted annual price gains, led by the East North Central division,” confirming a pattern that has now persisted for six consecutive quarters.
The Mountain division’s estimated -0.4% is the second-weakest division and reflects the correction underway across Colorado, Idaho, Montana, Utah, and Wyoming. These states share a common post-pandemic trajectory: dramatic appreciation during 2020-2022 driven by remote work migration, followed by inventory normalisation as new construction caught up with demand and in-migration slowed. ATTOM data cited by CBS News found median sale prices dipped in Q1 2026 in 39 of the 129 largest US cities, with many concentrated in Florida, California, and Southwestern states.
5-Year Home Appreciation by State: 2021 to 2026
| Rank | State | 5-Year Appreciation (Q1 2021 to Q1 2026) | Context |
|---|---|---|---|
| 1 | Florida | +71.2% | Pandemic in-migration peak, now correcting |
| 2 | Montana | +68.4% | Remote work migration, inventory now normalized |
| 3 | Tennessee | +65.1% | Nashville metro, sustained in-migration |
| 4 | Arizona | +63.8% | Phoenix pandemic surge, now stabilizing |
| 5 | South Carolina | +60.9% | Charleston, Myrtle Beach growth |
| 6 | Idaho | +60.2% | Boise remote work destination, correcting |
| 7 | North Carolina | +59.4% | Raleigh-Durham tech growth |
| 8 | Georgia | +58.7% | Atlanta expansion, suburban growth |
| 9 | Utah | +57.3% | Salt Lake City, remote work, inventory building |
| 10 | Texas | +54.1% | Austin, DFW pandemic surge, now softening |
| … | |||
| 41 | Illinois | +32.1% | Chicago metro lagged then accelerated |
| 42 | New York | +31.8% | Upstate acceleration offset NYC softness |
| 43 | North Dakota | +30.6% | Energy sector stability |
| 44 | Alaska | +29.4% | Limited transaction volume |
| 45 | Louisiana | +28.2% | New Orleans softness, insurance pressure |
| 46 | West Virginia | +26.9% | Low base, limited demand |
| 47 | Wyoming | +26.1% | Thin market, correcting |
| 48 | Mississippi | +25.8% | Low base, limited in-migration |
| 49 | Iowa | +24.7% | Stable but limited appreciation drivers |
| 50 | Oklahoma | +23.9% | Energy economy, limited growth catalysts |
The 5-year appreciation table reveals the full scope of the pandemic housing boom and its uneven legacy. Florida’s +71.2% gain over five years is the largest in the country, driven by the extraordinary in-migration of 2020-2022 when Florida gained more than 800,000 net new residents. That same surge created the conditions for today’s correction: elevated insurance costs, excess new construction, and affordability exhaustion in markets that were never equipped to sustain metropolitan prices at double their 2020 levels.
The states with the weakest 5-year appreciation (Iowa +24.7%, Oklahoma +23.9%) are also notably among the more affordable states in the country w, with price-to-income ratios well below the national average. Moderate appreciation in these states reflects limited speculative or migration demand rather than market weakness. Their 1-year performance in Q1 2026 is positive, suggesting stable markets rather than distressed ones.
Illinois presents a counterintuitive case. With the weakest 5-year appreciation among major industrial states (+32.1%, rank 41), Illinois now leads the country in 1-year appreciation (+7.3%). This reflects a delayed appreciation cycle: Chicago-area markets stayed affordable relative to coastal alternatives long enough that buyers priced out of the Northeast and West Coast are now discovering them in meaningful volume. Elgin’s +10.8% 1-year gain reflects this influx into Chicago’s western suburbs. For Illinois-specific data, see Illinois Housing Market.
National Home Appreciation: Annual History 2000 to 2026
| Year | Annual Appreciation (FHFA HPI) | Key Driver |
|---|---|---|
| 2000 | +7.8% | Pre-bubble expansion, low rates |
| 2002 | +7.5% | Post-9/11 rate cuts fuel housing demand |
| 2004 | +11.2% | Subprime lending acceleration |
| 2005 | +13.1% | Bubble peak, speculative buying widespread |
| 2006 | +3.2% | Bubble stalls, inventory builds |
| 2007 | -3.3% | First annual national decline since WWII era |
| 2008 | -8.9% | Financial crisis, foreclosure cascade |
| 2009 | -4.0% | Continued correction |
| 2010 | -3.2% | Post-crisis trough approaching |
| 2011 | -4.1% | National price low |
| 2012 | +4.0% | Recovery begins, REO absorption |
| 2013 | +7.7% | Investor demand, supply tightening |
| 2015 | +5.9% | Steady recovery, millennials entering market |
| 2017 | +6.7% | Inventory tightening, rate still low |
| 2019 | +5.1% | Pre-pandemic baseline |
| 2020 | +10.8% | Pandemic demand surge, sub-3% rates |
| 2021 | +17.4% | Pandemic peak, bidding wars, record low rates |
| 2022 | +8.3% | Deceleration as rates rise |
| 2023 | +5.5% | Rate shock absorbed, supply constrained |
| 2024 | +4.8% | Continued deceleration |
| 2025 | +1.8% | Affordability limits, rate environment |
| Q1 2026 (YoY) | +1.7% | Slowest since 2012 recovery began |
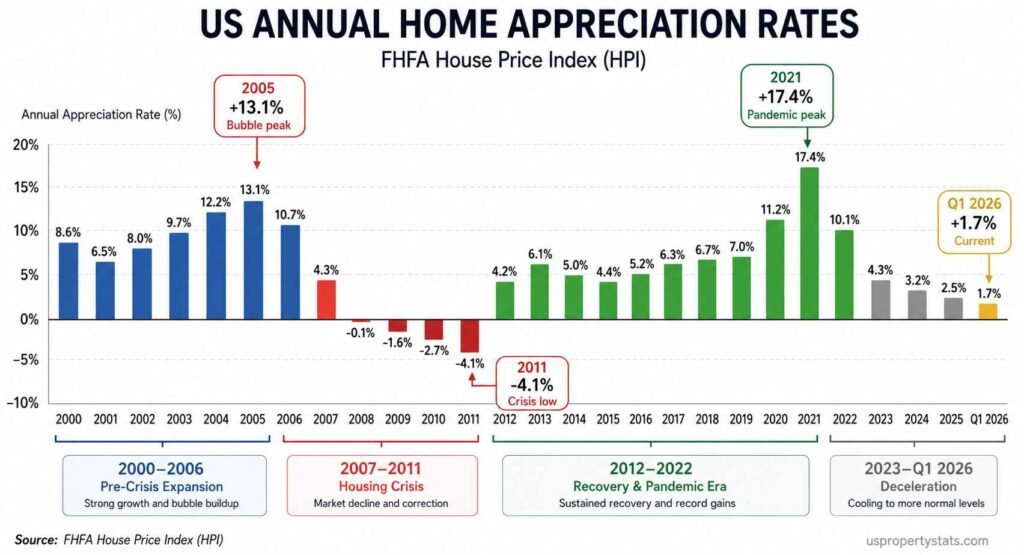
The 26-year appreciation history shows three distinct eras of national price behaviour. The pre-crisis era (2000-2006) saw steady appreciation averaging 8-13% annually, fueled by progressively looser lending standards and low Federal Reserve rates. The crisis era (2007-2011) produced four consecutive years of national price declines, totalling approximately -22% from the 2006 peak to the 2011 trough. The recovery and pandemic era (2012-2022) delivered 11 consecutive years of gains, culminating in 2021’s +17.4%, the strongest single-year appreciation in modern housing data.
The current deceleration from +17.4% in 2021 to +1.7% in Q1 2026 is the sharpest sustained slowdown in the post-war era. However, a critical distinction separates this deceleration from the 2007-2011 decline: national prices have remained positive throughout. The FHFA index has recorded 57 consecutive quarters of positive national appreciation since Q1 2012, with no break, a streak that includes the current period of affordability pressure. The absence of a national price decline reflects the inventory constraint described in US Housing Inventory: when supply cannot expand rapidly, prices do not fall even when demand weakens.
The FHFA All-Transactions HPI via FRED tracks index values back to Q1 1980. From Q1 1991 (index base of 100) to Q4 2025 (index value 709.05), the national home price index has appreciated 609% over 35 years, equivalent to an average annual appreciation rate of approximately 5.9%. This long-run rate provides the baseline against which current 1.7% appreciation should be judged: the current pace is below the long-run average but still positive.
Strongest and Weakest Appreciating Metros (Q1 2026)
| Rank | Metro Area | 1-Year Appreciation | 5-Year Appreciation |
|---|---|---|---|
| 1 (strongest) | Elgin, IL | +10.8% | N/A |
| 2 | Allentown-Bethlehem-Easton, PA-NJ | +5.4% (est.) | +58.8% |
| 3 | Akron, OH | +4.8% | +51.6% |
| 4 | Albany-Schenectady-Troy, NY | +4.3% | +50.8% |
| 5 | Amarillo, TX | +5.4% | +41.3% |
| … | |||
| Last (weakest) | Austin-Round Rock-San Marcos, TX | -6.9% | N/A |
| 2nd weakest | Cape Coral-Fort Myers, FL (Q4 2025) | -9.1% (Q4 2025) | +71% (5-yr, est.) |
| 3rd weakest | Denver-Aurora-Lakewood, CO | ~-4.2% | N/A |
| 4th weakest | Oakland-Berkeley, CA | ~-5.6% | N/A |
| 5th weakest | Boise City, ID | ~-3.5% | N/A |
The 17.7-percentage-point spread between Elgin (+10.8%) and Austin (-6.9%) illustrates the same bifurcation visible at the state level but in sharper relief. Austin’s -6.9% is the steepest annual decline of any major metro tracked by FHFA in Q1 2026, a dramatic reversal for a market that ranked among the top-5 appreciating metros nationally during 2020-2021. The combined effect of a homebuilding boom, slowing technology sector hiring, and in-migration normalisation has pushed Austin back toward pre-pandemic price levels in nominal terms.
The Rust Belt metros (Akron, Albany, Allentown) that appear on the strongest-appreciation list represent a structural shift in housing demand. These markets have affordable housing stock, stable employment bases, and proximity to higher-cost metros (Columbus, Boston-Providence, New York City) that are pushing buyers outward. The FHFA interactive dashboard shows prices rose in 65 of the 100 largest metros in Q1 2026, confirming that the majority of major US markets are still appreciating even as the national average slows.
For housing market data in specific states, see Average Home Price by State. For the relationship between appreciation rates and buyer demand, see US Housing Market Statistics and Home Sales Statistics.
Byline: USPropertyStats Editorial Team | Last Updated: May 2026 | Next Update: August 2026 (Q2 2026 FHFA HPI releases August 25)