The median number of days a US home spends on the market before going under contract was 55 days in March 2026, according to Redfin, up 7 days from a year ago. NAR reports a median of 32 days for April 2026 using a different methodology that measures only from active listing to contract. The gap between these two figures is not a data error; it reflects fundamentally different measurement approaches that need to be understood before using DOM data.
This page tracks how long homes are taking to sell nationally, historically, and by market type. Data is sourced from NAR, Redfin, Realtor.com, and FRED (MEDDAYONMARUS). All figures are medians unless stated otherwise. Updated monthly.
| Source | DOM Metric | Latest Value | Period | YoY Change |
|---|---|---|---|---|
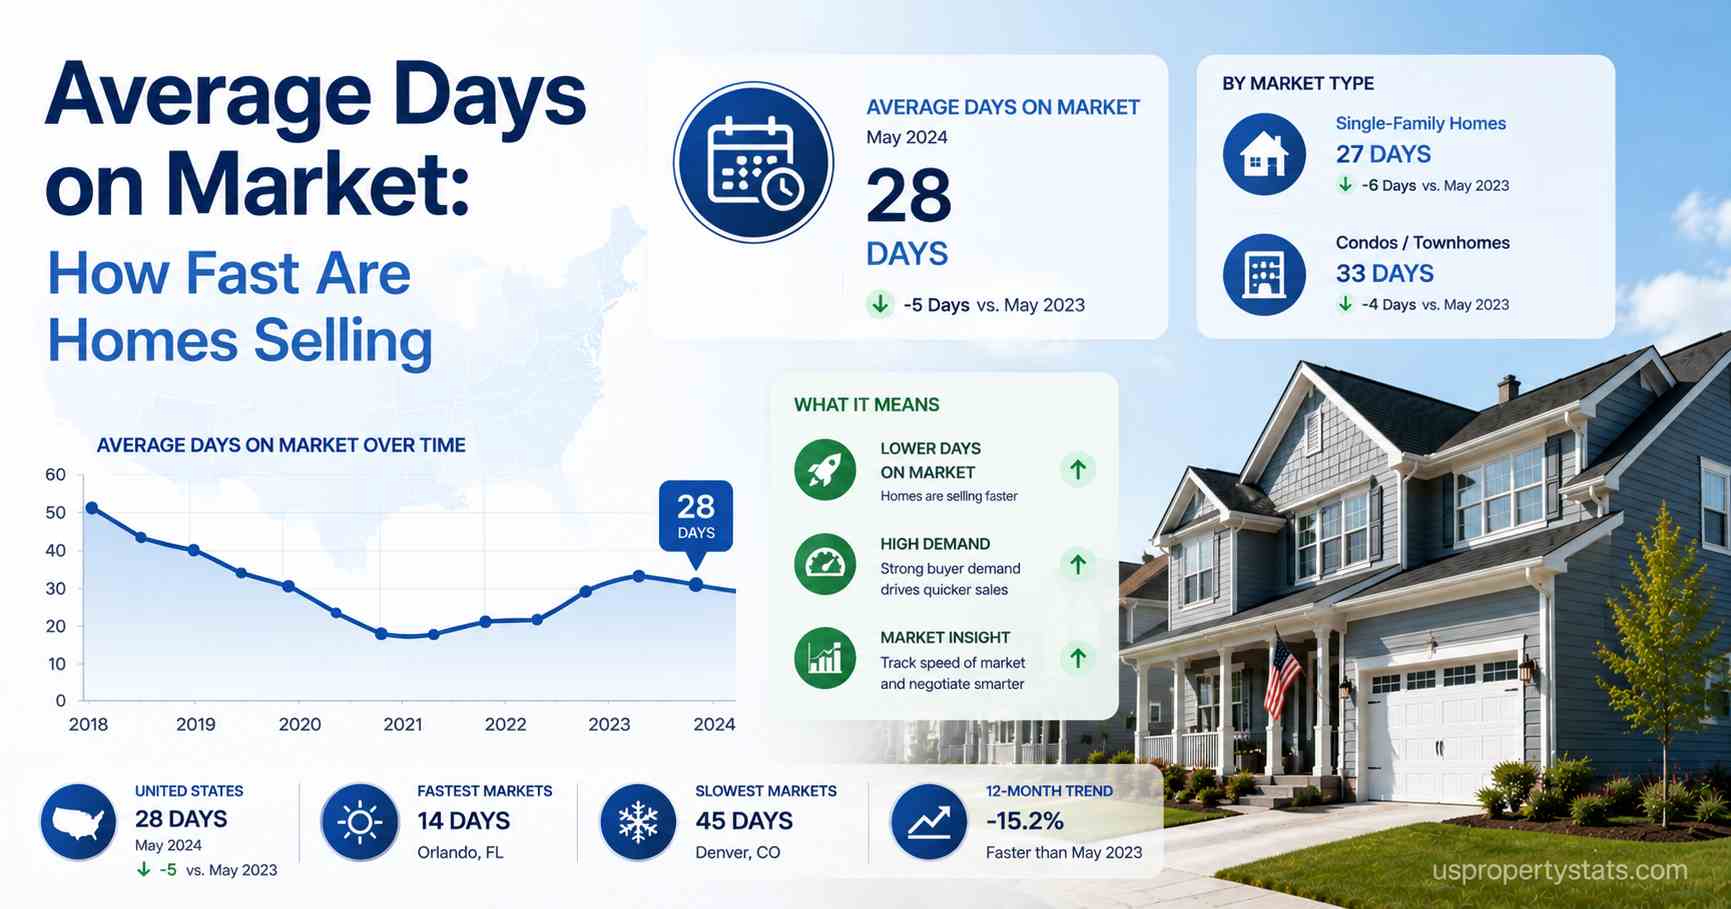
| NAR | Median days, list to contract (MLS) | 32 days | April 2026 | +3 days |
| Redfin | Median days, list to pending (all homes) | 55 days | March 2026 | +7 days |
| Realtor.com / FRED | Median days on market (active listings) | 66 days | February 2026 | +8 days |
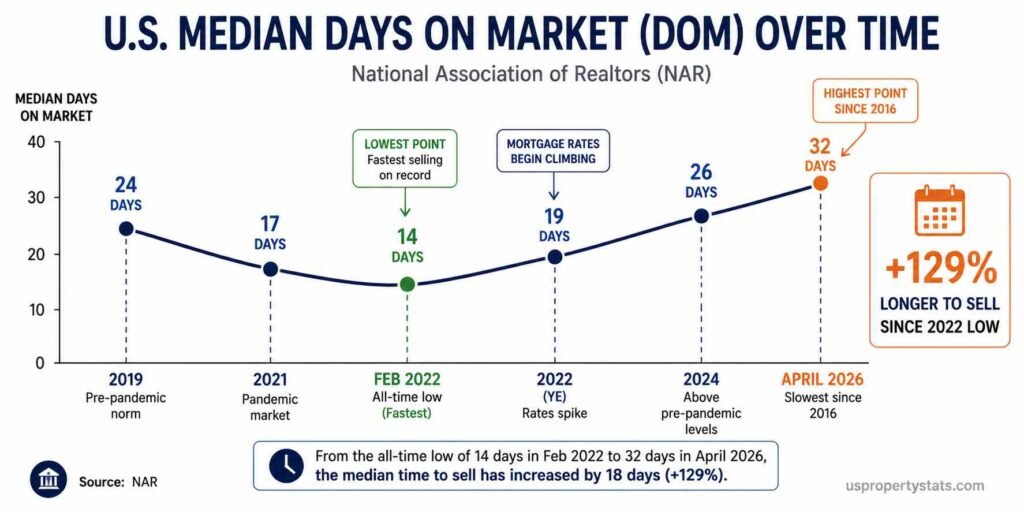
| Pandemic-era low (NAR) | Median days, list to contract | 14 days | February 2022 | N/A |
| Pre-pandemic norm (NAR) | Median days, list to contract | 24 days | 2019 annual avg | N/A |
The three figures above measure the same concept differently. NAR counts days from when a listing appears on the MLS to when the seller accepts an offer, excluding days when the home was temporarily taken off the market.
Redfin counts from the first listing date to the date the home enters pending status across all homes in its database, including re-listings. Realtor.com’s metric via FRED measures days active on their platform. For trend analysis, the most important thing is to compare each source’s figure to its own historical baseline rather than across sources.
Monthly DOM Trend: 2024 to 2026
| Month | NAR Median DOM | Redfin Median DOM | YoY Change (Redfin) |
|---|---|---|---|
| April 2026 | 32 days | N/A | N/A |
| March 2026 | 36 days | 55 days | +7 days |
| February 2026 | N/A | 66 days | +8 days |
| January 2026 | N/A | 64 days | +7 days |
| December 2025 | N/A | 60 days | +6 days |
| November 2025 | N/A | 64 days | +3 days |
| October 2025 | N/A | N/A | N/A |
| April 2025 | 29 days | 48 days | N/A |
| April 2024 | 26 days | 41 days | N/A |
| April 2023 | 22 days | N/A | N/A |
| February 2022 (low) | 14 days | N/A | N/A |
| 2019 annual avg | 24 days | N/A | N/A |
The trend across both sources is consistent: homes are taking longer to sell with each passing year since the 2022 pandemic-era low. NAR’s median DOM has increased from 14 days in February 2022 to 32 days in April 2026, a 129% increase in time-to-sell over four years. The pre-pandemic norm was 24 days, meaning the market has now surpassed the pre-pandemic pace and is selling more slowly than in 2019.
Redfin reported that January 2026’s 64-day national median was the longest span in six years, representing the 22nd consecutive month of year-over-year increases in time on market. February 2026’s 66 days were described as the slowest February pace since 2016.
Redfin Senior Economist Asad Khan noted the Iran War’s impact: “The war in Iran, skyrocketing gas prices, and other economic jitters are making homebuyers nervous,” causing buyers who had returned to the market during the brief sub-6% rate window in late February to pull back again as rates spiked.
Realtor.com’s data recorded 20 consecutive months of year-over-year increases in time on market through November 2025. This streak is the longest sustained deceleration in selling pace in modern housing data outside the 2007-2011 crisis period. Unlike that crisis, however, the current slowdown is occurring without significant price declines or distressed sales, pointing to buyer caution rather than market distress as the driver.
Fastest and Slowest Housing Markets by DOM
| # | Metro Area | Median DOM | Period | YoY Change |
|---|---|---|---|---|
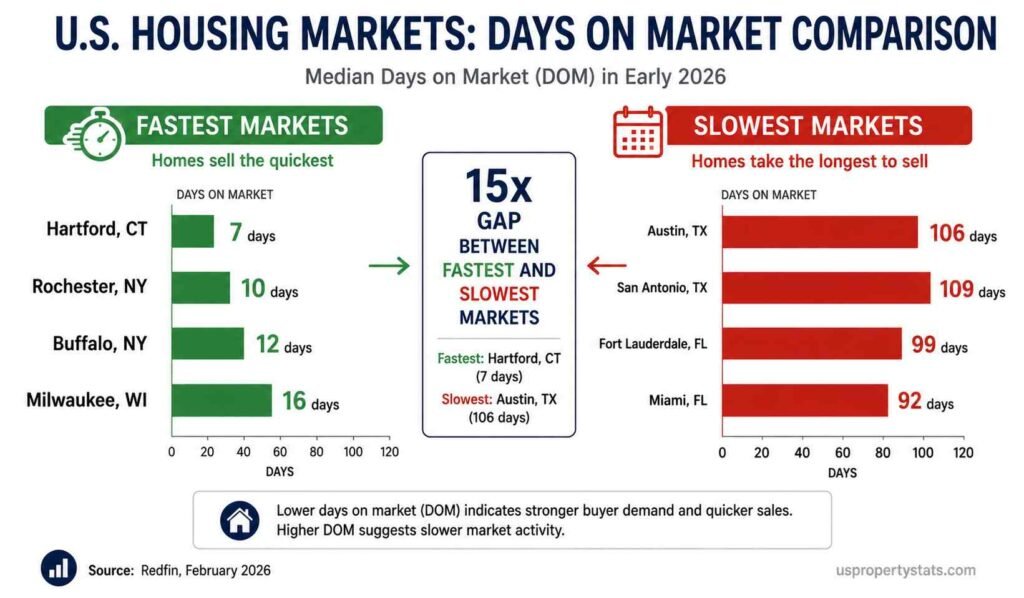
| 1 | Hartford, CT | ~7 days | February 2026 | N/A |
| 2 | Rochester, NY | ~10 days | February 2026 | N/A |
| 3 | Buffalo, NY | ~12 days | February 2026 | N/A |
| 4 | Manchester, NH | ~14 days | February 2026 | N/A |
| 5 | Providence, RI | ~15 days | February 2026 | N/A |
| 6 | Milwaukee, WI | ~16 days | February 2026 | N/A |
| 7 | Columbus, OH | ~18 days | February 2026 | N/A |
| 8 | Boston, MA | ~20 days | February 2026 | N/A |
| 9 | Indianapolis, IN | ~21 days | February 2026 | N/A |
| 10 | Kansas City, MO | ~22 days | February 2026 | N/A |
| # | Metro Area | Median DOM | Period | YoY Change |
|---|---|---|---|---|
| 1 | Austin, TX | 106 days | December 2025 | +15 days |
| 2 | San Antonio, TX | 99-109 days | Dec 2025 / Feb 2026 | +28 days |
| 3 | Fort Lauderdale, FL | 99 days | December 2025 | N/A |
| 4 | Miami, FL | 92 days | December 2025 | N/A |
| 5 | West Palm Beach, FL | 87 days | December 2025 | N/A |
| 6 | Denver, CO | ~75 days | February 2026 | N/A |
| 7 | Phoenix, AZ | ~72 days | February 2026 | N/A |
| 8 | Raleigh, NC | ~70 days | February 2026 | +30 days YoY |
| 9 | Tampa, FL | ~68 days | February 2026 | N/A |
| 10 | Orlando, FL | ~65 days | February 2026 | N/A |
The 15x gap between Hartford (7 days) and Austin (106 days) is the starkest illustration of how differently the housing market is functioning across geographies. These are not marginally different markets; they are operating under opposite supply-demand dynamics. Hartford’s severe inventory shortage produces immediate multi-offer competition and near-instant sales. Austin’s excess inventory, a product of a homebuilding boom combined with slowing in-migration, gives buyers time to negotiate and creates a market where sellers are accepting offers well below list price.
Redfin’s Austin report captures this reversal precisely: “Homebuyers in Austin have the luxury of time and bargaining power. I have a buyer who just offered $560,000 for a home that was listed at $599,000 and a few years ago would’ve been worth $700,000. There’s a pretty good chance the seller will say yes, given how slow the market is.” Austin’s 106-day December reading was the slowest in records dating to 2012, a complete reversal from 2021-2022 when Austin was among the fastest-moving markets in the country.
San Antonio posted the largest year-over-year DOM increase of any major metro in February 2026 at +28 days, according to Redfin data. Raleigh showed the largest DOM increase of any tracked city at +30 days year-over-year, reflecting North Carolina’s transition from a pandemic-era growth market to one facing an inventory overhang from rapid new construction. These are the markets where buyer leverage is most pronounced and where price negotiation room is greatest in 2026.
The fastest markets share a single characteristic: severe inventory shortages. Analysis of February 2026 Redfin data found that all top-10 fastest-selling metros have active inventory significantly below pre-pandemic 2019 levels, and 7 of the top 10 are in the Northeast. These markets benefit from buyers priced out of tier-1 cities like Boston and New York City flooding secondary markets, including Hartford, Providence, and Rochester, driving intense competition for limited stock.
DOM by Property Type and Price Tier
| Segment | Approximate Median DOM | Market Condition | Notes |
|---|---|---|---|
| Entry-level (below $300K) | 15-25 days | Strong seller’s market | Acute shortage, multiple offers common |
| Mid-tier ($300K-$500K) | 30-45 days | Balanced to slight seller’s market | Varies heavily by region |
| Upper-mid ($500K-$750K) | 45-60 days | Balanced market | Affordability limits buyer pool |
| Luxury ($750K-$1M) | 60-80 days | Balanced to slight buyer’s market | Rate-sensitive buyers pulling back |
| Ultra-luxury (above $1M) | 80-120 days | Buyer’s market | Stock market wealth effect, less urgent |
| New construction (all price tiers) | Varies (builder-defined) | Buyer’s market nationally | 8.5 months supply; builder incentives active |
The price-tier breakdown reveals the inverse relationship between affordability and selling speed. Entry-level homes below $300,000 are the scarcest segment in the US housing market. Zillow Research notes that entry-level inventory has declined at a faster rate than mid-tier or luxury inventory because the lock-in effect disproportionately affects lower-priced homeowners, who have the largest rate differentials between their existing mortgages and current market rates. The result is that the most affordable homes sell fastest, the opposite of what would help first-time buyers.
The upper-mid and luxury tiers above $500,000 show meaningfully longer selling times, reflecting both a smaller pool of qualifying buyers at current rate levels and increased negotiating leverage for buyers who can afford to wait. A household needs approximately $110,000 in annual income to qualify for the median-priced home at 6.51% rates with 20% down. Homes above $750,000 require income levels that exclude more than 85% of American households, making these markets inherently thinner and slower regardless of inventory conditions.
Historical DOM: How Current Pace Compares to Past Markets
| Year / Period | NAR Median DOM | Market Character | 30-Year Rate (avg) |
|---|---|---|---|
| 2019 (pre-pandemic norm) | 24 days | Balanced, low inventory | 3.94% |
| 2020 | 21 days | Pandemic demand surge begins | 3.11% |
| 2021 | 17 days | Extreme seller’s market | 2.96% |
| February 2022 (low) | 14 days | Fastest pace ever recorded | ~3.7% |
| 2022 (full year) | 19 days | Rapid deceleration as rates rise | 5.34% |
| 2023 | 23 days | Continued normalization | 6.81% |
| 2024 | 26 days | Above pre-pandemic baseline | 6.72% |
| 2025 | ~29 days | Continued deceleration | 6.84% |
| April 2026 | 32 days | Slowest April since 2016 | 6.51% |
The historical table documents a complete cycle. From 2019 to February 2022, selling times compressed from 24 days to 14 days as pandemic demand and sub-3% mortgage rates created the most competitive buyer environment in modern housing history. The subsequent four years have seen a steady reversal: from 14 days in early 2022 to 32 days in April 2026, a 129% increase. The April 2026 reading is the slowest for that month since 2016, according to Redfin.
The deceleration is not uniform or linear. The sharpest single-year DOM increase occurred in 2022, when the Federal Reserve raised the federal funds rate by 425 basis points, pushing the 30-year mortgage rate from approximately 3% to above 7% in under 12 months. That rate shock instantly removed a large share of the buyer pool, and homes that would have sold in 14 days in February 2022 took 19 days on average by year-end. The subsequent years (2023-2026) have seen more gradual deceleration as the market adjusts to an above-6% rate environment.
The current 32-day NAR median is not alarming in a historical context. It is 8 days above the pre-pandemic 2019 norm but well within historical ranges seen throughout the 2012-2018 recovery period. What distinguishes the current market from prior slow periods is the absence of distressed selling pressure.
During the 2009-2012 period when DOM exceeded 70-90 days in many markets, foreclosures and short sales were driving forced sales at deep discounts. In 2026, the 2% distressed sales share confirms that slow DOM reflects buyer caution, not seller desperation. For related context, see US Housing Inventory, Home Sales Statistics, and Foreclosure Statistics: Filings, Rates, and Trends.
What DOM Data Tells Buyers and Sellers
| DOM Range | Market Signal | Buyer Implication | Seller Implication |
|---|---|---|---|
| Under 7 days | Extreme seller’s market | Expect multiple offers, waive contingencies carefully | List at or above market; expect full price or above |
| 7-21 days | Seller’s market | Act quickly; pre-approval essential | Strong negotiating position; limited concessions needed |
| 21-45 days (current national NAR) | Mild seller’s market | Some room to negotiate; inspections recommended | Price correctly; expect minor concessions |
| 45-90 days (current Redfin national) | Balanced to mild buyer’s market | Negotiate on price, repairs, closing costs | Price below comparable sales; incentives may help |
| Above 90 days (Sun Belt markets) | Buyer’s market | Significant negotiation room; request concessions | Reduce price or offer rate buydowns to attract buyers |
DOM is most useful as a local rather than a national metric. Redfin’s buyer guidance notes that “normal varies widely by market. In fast-moving metros, including parts of the Midwest and Northeast, homes can go under contract in under two weeks. In slower Sun Belt markets like Austin or Miami, 90-plus days is increasingly common. Your best benchmark is local data.” Comparing a specific property’s DOM against the local median is more actionable than comparing it to national averages.
A home with DOM significantly above the local median is a signal worth investigating. It may indicate overpricing relative to comparable sales, a condition issue discovered during showing, or a location disadvantage. In the current market, where sellers in slower markets are accepting significant discounts (Austin buyers successfully offering $39,000 below list price on a $599,000 home, per Redfin), high-DOM properties offer negotiation opportunities that did not exist in 2021-2022.
Conversely, in tight inventory markets like Hartford, Rochester, or Columbus, where median DOM is under 20 days, buyers who wait to negotiate are at risk of losing the home entirely. In these markets, the strategic question is not how much to offer below the list, but whether to offer above the list and waive appraisal contingencies. The national DOM figure does not capture this bifurcation; local market data is essential. For price context alongside DOM, see Median Home Price in the US and US Housing Market Statistics.
Byline: USPropertyStats Editorial Team | Last Updated: May 2026 | Next Update: June 2026