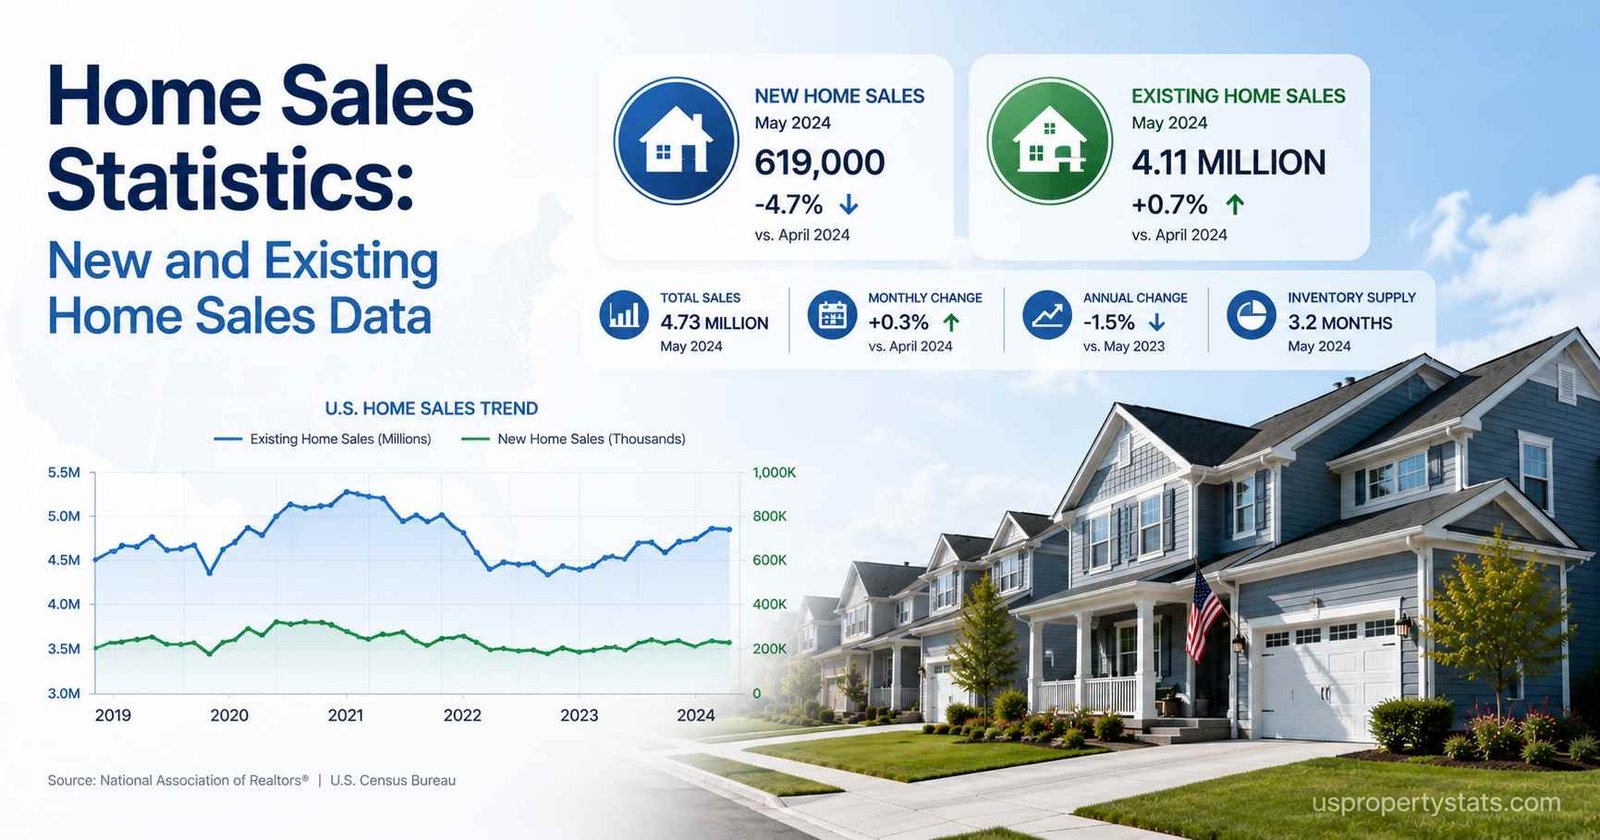
Existing-home sales in the US reached 4.02 million (SAAR) in April 2026, according to the National Association of Realtors. New single-family home sales reached 682,000 (SAAR) in March 2026, per the US Census Bureau and HUD. Combined, these two markets represent the primary data sources for tracking how many homes Americans are buying and selling each month.
This page presents monthly home sales data for both existing and new homes, annual historical trends from 2000 to 2026, regional breakdowns, buyer type composition, and key sales metrics, including days on market, cash transactions, and distressed sales. Data is sourced from NAR, the US Census Bureau, and FRED. Updated monthly.
| Metric | Latest Value | Period | MoM Change | YoY Change |
|---|---|---|---|---|
| Existing-Home Sales (SAAR) | 4.02 million | April 2026 | +0.2% | Flat |
| New Home Sales (SAAR) | 682,000 | March 2026 | +7.4% | +3.3% |
| Total Combined (est.) | ~4.70 million | April / March 2026 | N/A | N/A |
| Existing-Home Median Price | $417,800 | April 2026 | +4.8% | +0.9% |
| New-Home Median Price | $387,400 | March 2026 | -5.3% | -6.2% |
| Existing-Home Inventory | 1.47 million | April 2026 | +8.1% | +5.8% |
| New-Home Inventory | 476,000 | January 2026 | +0.4% | -4.0% |
| Existing Months of Supply | 4.4 months | April 2026 | +0.3 mo | +0.1 mo |
| New-Home Months of Supply | 8.5 months | March 2026 | -0.6 mo | -0.7 mo |
| Median Days on Market | 32 days | April 2026 | Flat | +3 days |
The headline number for April 2026 is functionally unchanged from a year ago. The 4.02 million SAAR pace is flat year-over-year and only marginally above April 2025’s 4.00 million. Both the existing and new home markets are in holding patterns: existing-home sales are locked in by the rate lock-in effect, suppressing supply, while new-home sales are being artificially supported by builder price cuts averaging 6% and incentive programs active at 61% of builders.
Monthly Existing-Home Sales: 12-Month Trend
| Month | Sales (SAAR, millions) | MoM Change | YoY Change | Median Price | Months Supply |
|---|---|---|---|---|---|
| April 2026 | 4.02 | +0.2% | Flat | $417,800 | 4.4 |
| March 2026 | 3.98 | -3.6% | -2.9% | $408,800 | 4.1 |
| February 2026 | 4.09 | +1.7% | -0.7% | $398,000 | 3.8 |
| January 2026 | 4.02 | -3.4% | +2.0% | $396,900 | 3.5 |
| December 2025 | 4.16 | +1.5% | +4.7% | $404,400 | 3.3 |
| November 2025 | 4.10 | +3.8% | +6.1% | $406,100 | 3.4 |
| October 2025 | 3.95 | +3.4% | +2.9% | $407,200 | 3.4 |
| September 2025 | 3.82 | -1.3% | +3.5% | $406,400 | 3.4 |
| August 2025 | 3.87 | +1.3% | +1.3% | $416,700 | 3.5 |
| July 2025 | 3.82 | -1.5% | -2.3% | $431,600 | 3.5 |
| June 2025 | 3.88 | +1.6% | -5.4% | $434,500 | 3.7 |
| May 2025 | 3.82 | -5.9% | -2.1% | $422,800 | 3.7 |
| April 2025 | 4.00 | -1.5% | -1.9% | $414,000 | 4.3 |
The 12-month trend shows a market that dipped to a low of 3.82 million in summer 2025, recovered through year-end to 4.16 million in December, then pulled back to 3.98 million in March 2026 before edging back up. The range over the past 12 months is 340,000 units, from 3.82M to 4.16M. This is an unusually narrow band for an annual cycle, which historically shows larger seasonal swings. The compressed range confirms that neither demand nor supply forces are strong enough to push sales meaningfully in either direction.
March 2026’s 3.98 million reading was the lowest in nine months and missed market expectations of 4.06 million. NAR Chief Economist Lawrence Yun attributed the miss to “lower consumer confidence and softer job growth,” while also noting that inventory improvement has been “gradual rather than sudden.”
The April rebound of 0.2% was below the consensus forecast of 4.05 million, described by Trading Economics as “pressured by higher mortgage rates after the surge in energy prices drove long-term Treasury yields higher” following the Iran War escalation.
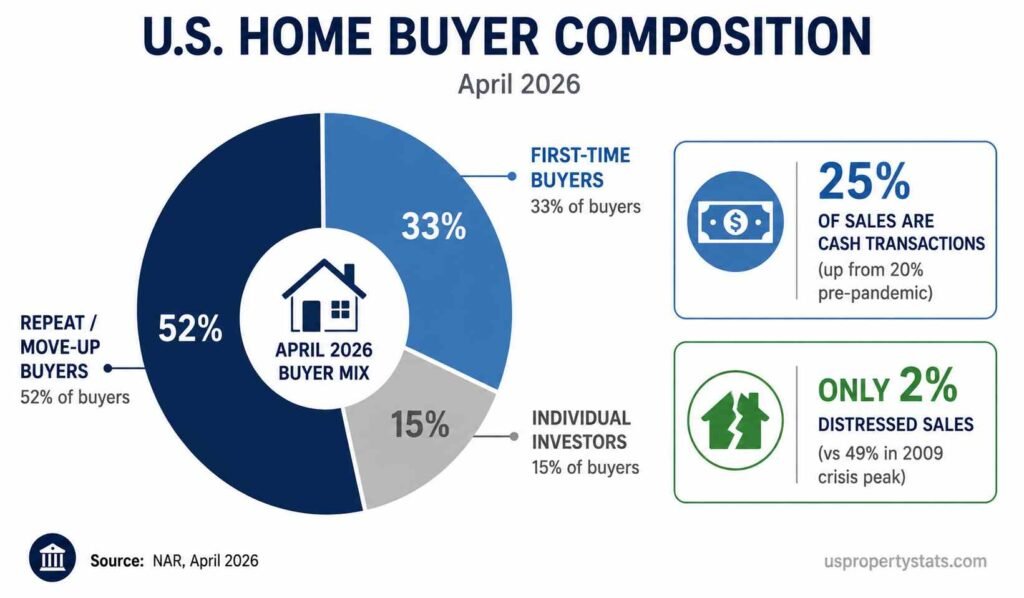
First-time buyers represented 33% of April 2026 sales, up from 32% in March but down from 34% a year ago. Cash transactions accounted for 25% of April sales, unchanged year-over-year. Distressed sales, including foreclosures and short sales, held at 2% of transactions, near historic lows that indicate no forced-selling pressure in the market.
Monthly New-Home Sales: 2025-2026 Trend
| Month | Sales (SAAR, thousands) | MoM Change | YoY Change | Median Price | Months Supply |
|---|---|---|---|---|---|
| March 2026 | 682 | +7.4% | +3.3% | $387,400 | 8.5 |
| February 2026 | 636 | +8.3% | -4.8% | $409,000 | 9.1 |
| January 2026 | 587 | -17.6% | -11.3% | $400,500 | 9.7 |
| December 2025 | 712 | +3.3% | +6.7% | $419,200 | 8.0 |
| November 2025 | 689 | +5.9% | +8.5% | $402,600 | 8.9 |
| October 2025 | 651 | -7.0% | +1.9% | $414,900 | 9.1 |
| September 2025 | 700 | +4.5% | +6.1% | $426,300 | 8.3 |
| August 2025 | 670 | +4.7% | +9.8% | $420,600 | 8.7 |
| July 2025 | 640 | -2.4% | +2.2% | $429,500 | 8.6 |
| June 2025 | 656 | +5.8% | -6.4% | $417,300 | 8.2 |
| May 2025 | 620 | -11.4% | -4.6% | $422,500 | 9.5 |
| April 2025 | 660 | +10.0% | -3.7% | $412,900 | N/A |
January 2026’s 587,000 SAAR was the lowest new-home sales reading in over a year, driven by the combination of the Iran War mortgage rate spike and post-holiday buyer withdrawal. The subsequent rebound to 636,000 in February and 682,000 in March was supported by builder concessions. The March reading of 682,000 was 7.4% above February and 3.3% above the year-ago pace, the strongest year-over-year comparison in the new-home market for several months.
The new-home median price trajectory tells the real story. Median new-home prices peaked at approximately $429,500 in July 2025 and have been declining since, reaching $387,400 in March 2026, a 9.8% drop from the July peak in eight months. This is not a market correction; it is active builder discounting. The NAHB reports 32% of builders cut prices in May 2026 with an average reduction of 6%, while 61% offered additional sales incentives, including mortgage rate buydowns, upgraded finishes, and absorbed closing costs.
New-home months of supply at 8.5 (March 2026) remains nearly double the existing-home market’s 4.4 months. The Census Bureau notes that new-home supply peaked at 9.7 months in January 2026, the highest reading since 2009, before declining to 8.5 as sales improved. Normalising this supply requires either a significant increase in buyer demand or a reduction in builder starts, both of which appear to be occurring slowly.
Annual Home Sales: Historical Data 2000 to 2026
| Year | Existing Sales (millions) | New Sales (thousands) | Total (est., millions) | 30-Year Rate (avg) |
|---|---|---|---|---|
| 2000 | 5.15 | 877 | 6.03 | 8.05% |
| 2002 | 5.56 | 973 | 6.53 | 6.54% |
| 2004 | 6.78 | 1,203 | 7.98 | 5.84% |
| 2005 | 7.08 | 1,283 | 8.36 | 5.87% |
| 2006 | 6.48 | 1,051 | 7.53 | 6.41% |
| 2008 | 4.91 | 485 | 5.40 | 6.03% |
| 2010 | 4.19 | 323 | 4.51 | 4.69% |
| 2012 | 4.66 | 368 | 5.03 | 3.66% |
| 2014 | 4.94 | 437 | 5.38 | 4.17% |
| 2016 | 5.45 | 561 | 6.01 | 3.65% |
| 2018 | 5.34 | 617 | 5.96 | 4.54% |
| 2019 | 5.34 | 681 | 6.02 | 3.94% |
| 2020 | 5.64 | 822 | 6.46 | 3.11% |
| 2021 | 6.12 | 771 | 6.89 | 2.96% |
| 2022 | 5.03 | 645 | 5.68 | 5.34% |
| 2023 | 4.09 | 668 | 4.76 | 6.81% |
| 2024 | 4.06 | ~620 | ~4.68 | 6.72% |
| 2025 | ~4.07 | ~660 | ~4.73 | 6.84% |
| 2026 (pace) | ~4.02 | ~660 | ~4.68 | 6.51% (May) |
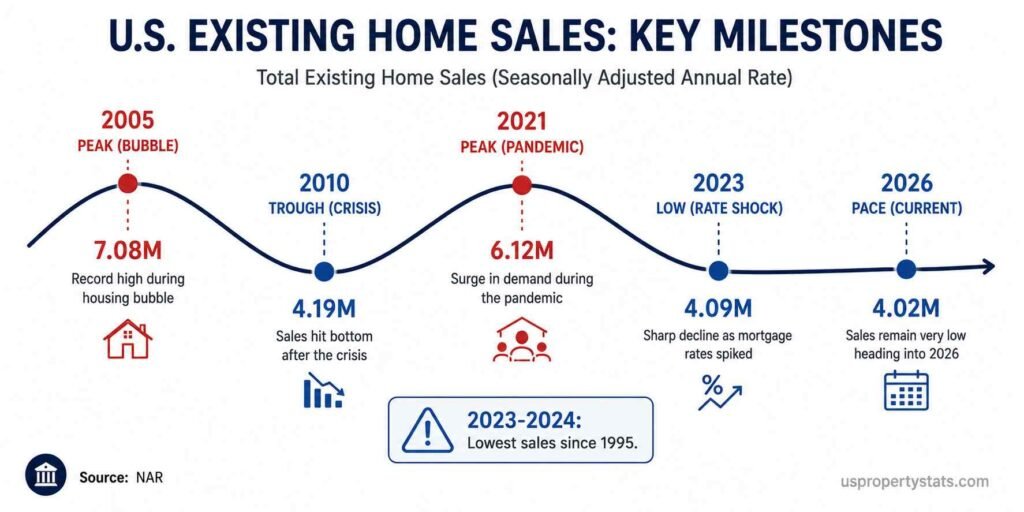
The historical table reveals two boom-bust cycles in modern home sales data. The first peaked in 2005 at a combined 8.36 million sales before collapsing to a trough of approximately 4.51 million in 2010. The second cycle peaked in 2021 at 6.89 million before declining sharply to approximately 4.68 million in 2024. The 2021 peak was driven by pandemic-era demand and sub-3% mortgage rates; the collapse was driven by the sharpest rate increase cycle since the early 1980s.
The most striking data point in the annual table is 2023 and 2024’s existing-home sales of 4.09 million and 4.06 million, respectively. These are the two lowest annual totals for existing-home sales since 1995, according to NAR records. The 2006-to-2010 collapse that triggered the Great Recession saw existing-home sales fall from 6.48 million to 4.19 million. The 2022-to-2024 collapse was nearly identical in magnitude, dropping from 5.03 million to 4.06 million, yet without triggering comparable distress because it was driven by rate-induced buyer withdrawal rather than forced selling.
New-home sales have remained more stable than existing-home sales during the current cycle. The 2021 peak of 771,000 declined to 645,000 in 2022 and 668,000 in 2023, a much smaller percentage decline than existing-home sales. This reflects builder flexibility to use incentives and price cuts to maintain volume, an option not available to individual existing-home sellers who cannot afford to discount below their mortgage balance.
Existing-Home Sales by Region
| Region | April 2026 (SAAR, thousands) | MoM Change | YoY Change | Share of Total |
|---|---|---|---|---|
| South | 1,790 | +0.6% | +1.1% | 44.5% |
| Midwest | 950 | +2.2% | -2.1% | 23.6% |
| West | 750 | -2.6% | Flat | 18.7% |
| Northeast | 500 | Flat | -2.9% | 12.4% |
| Total US | 4,020 | +0.2% | Flat | 100% |
The South accounts for 44.5% of all existing-home sales, a disproportionate share that reflects the region’s combination of population growth, relative affordability compared to coastal markets, and higher inventory levels enabling transactions. April 2026 was the only region to post year-over-year sales growth (+1.1%), consistent with Florida, Texas, Georgia, and the Carolinas continuing to absorb in-migration demand despite affordability challenges.
The Midwest posted the strongest month-over-month gain (+2.2%) in April 2026, driven by tight inventory markets in Ohio, Illinois, Michigan, and Indiana, where price-to-income ratios remain more favourable than national averages. However, the Midwest showed -2.1% year-over-year, suggesting spring 2025 was comparatively stronger, possibly due to a brief rate dip that pulled forward demand.
The West’s -2.6% month-over-month and flat year-over-year performance reflects continued affordability exhaustion in California, Colorado, and the Pacific Northwest, where median prices above $500,000 combined with 6.5% mortgage rates price out a substantial share of potential buyers. The Northeast’s flat month-over-month and -2.9% year-over-year result is more supply-driven than demand-driven; inventory in Connecticut, New Jersey, and Massachusetts remains so constrained that the primary limit on sales is homes available to buy, not buyers willing to purchase.
Key Sales Metrics: Buyer Composition and Transaction Type
| Metric | April 2026 | March 2026 | April 2025 | April 2019 (pre-pandemic) |
|---|---|---|---|---|
| First-Time Buyers (% of sales) | 33% | 32% | 34% | 32% |
| Cash Transactions (% of sales) | 25% | 26% | 25% | 20% |
| Distressed Sales (% of sales) | 2% | 2% | 3% | 2% |
| Individual Investors (% of sales) | 15% | 15% | 16% | 14% |
| Median Days on Market | 32 days | 36 days | 29 days | 24 days |
| Properties With Multiple Offers | ~29% | ~27% | ~31% | N/A |
The buyer composition data reveals a market that looks structurally similar to pre-pandemic norms in some dimensions but has diverged sharply in others. First-time buyer share at 33% is actually above the pre-pandemic 2019 level of 32%, which is counterintuitive given affordability pressure. It reflects in part that move-up buyers are deterred by the lock-in effect (they would have to give up their low-rate mortgage), which paradoxically makes first-time buyer share relatively higher even as total first-time buyer volume is lower.
Cash transaction share at 25% is the most notable deviation from pre-pandemic norms. The 2019 cash share was 20%. The 5-percentage-point increase reflects wealthy buyers choosing to avoid the rate environment entirely, plus institutional and investor activity that remains elevated despite the slowdown in iBuyer programs. A higher cash share compresses available inventory for financed buyers, effectively making the affordability problem worse for rate-sensitive households.
Distressed sales at 2% confirm that forced selling pressure is not a significant factor in the 2026 market. This is the critical structural difference between the current slowdown and the 2008-2011 crisis, where distressed sales peaked at 49% of all transactions in 2009. With ATTOM Data reporting foreclosure filings at historically low levels and homeowner equity at record highs, a distressed-selling cascade is not among the realistic risk scenarios for 2026. For foreclosure-specific data, see Foreclosure Statistics: Filings, Rates, and Trends.
Days on market rising from 24 days (April 2019) to 32 days (April 2026) quantifies the normalisation of market pace. The 8-day increase represents a meaningful shift in buyer urgency. Homes are still selling, but buyers are taking more time to make decisions, waiving fewer contingencies, and in many markets successfully negotiating seller concessions. This trend is most pronounced in the South and West, where inventory improvement has given buyers more options and leverage.
For related data, see US Housing Market Statistics, Median Home Price in the US, and Average Days on Market: How Fast Are Homes Selling.
Byline: USPropertyStats Editorial Team | Last Updated: May 2026 | Next Update: June 2026 (May NAR data releases June 9)