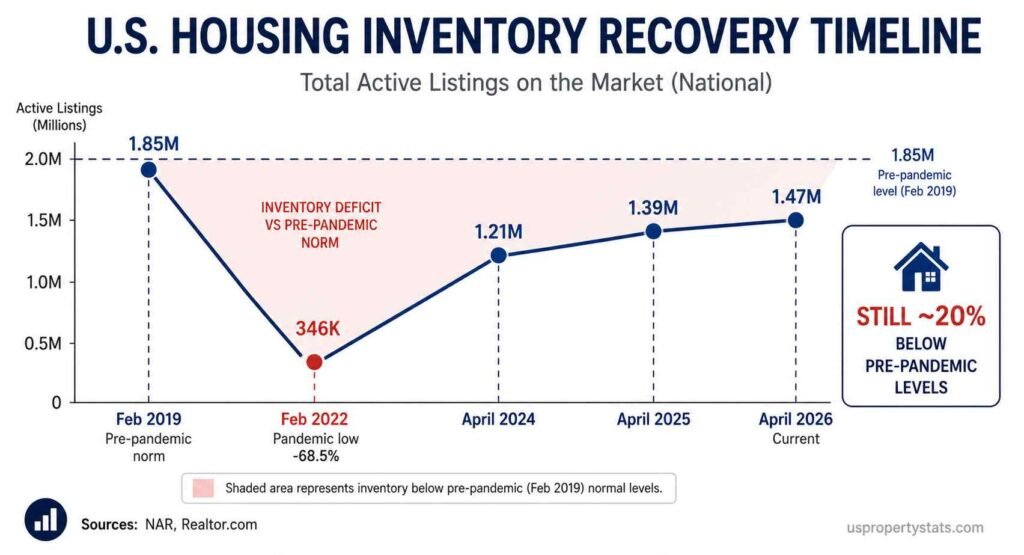
US housing inventory reached 1.47 million active listings in April 2026, equivalent to 4.4 months of supply at the current sales pace, according to the National Association of Realtors. That is 5.8% above April 2025 but remains approximately 20% below the pre-pandemic 2017-2019 average of roughly 1.85 million units. The year-over-year inventory growth rate has decelerated sharply, from +30.6% in April 2025 to +4.6% in April 2026, according to ResiClub’s analysis of Realtor.com data.
This page tracks US housing inventory across three dimensions: the monthly trend in active listings and months of supply, the geographic split between markets above and below pre-pandemic norms, and the structural factors constraining supply. All data is sourced from NAR, Realtor.com, FRED, and Zillow Research. Updated monthly.
| Metric | Value | Period | YoY Change |
|---|---|---|---|
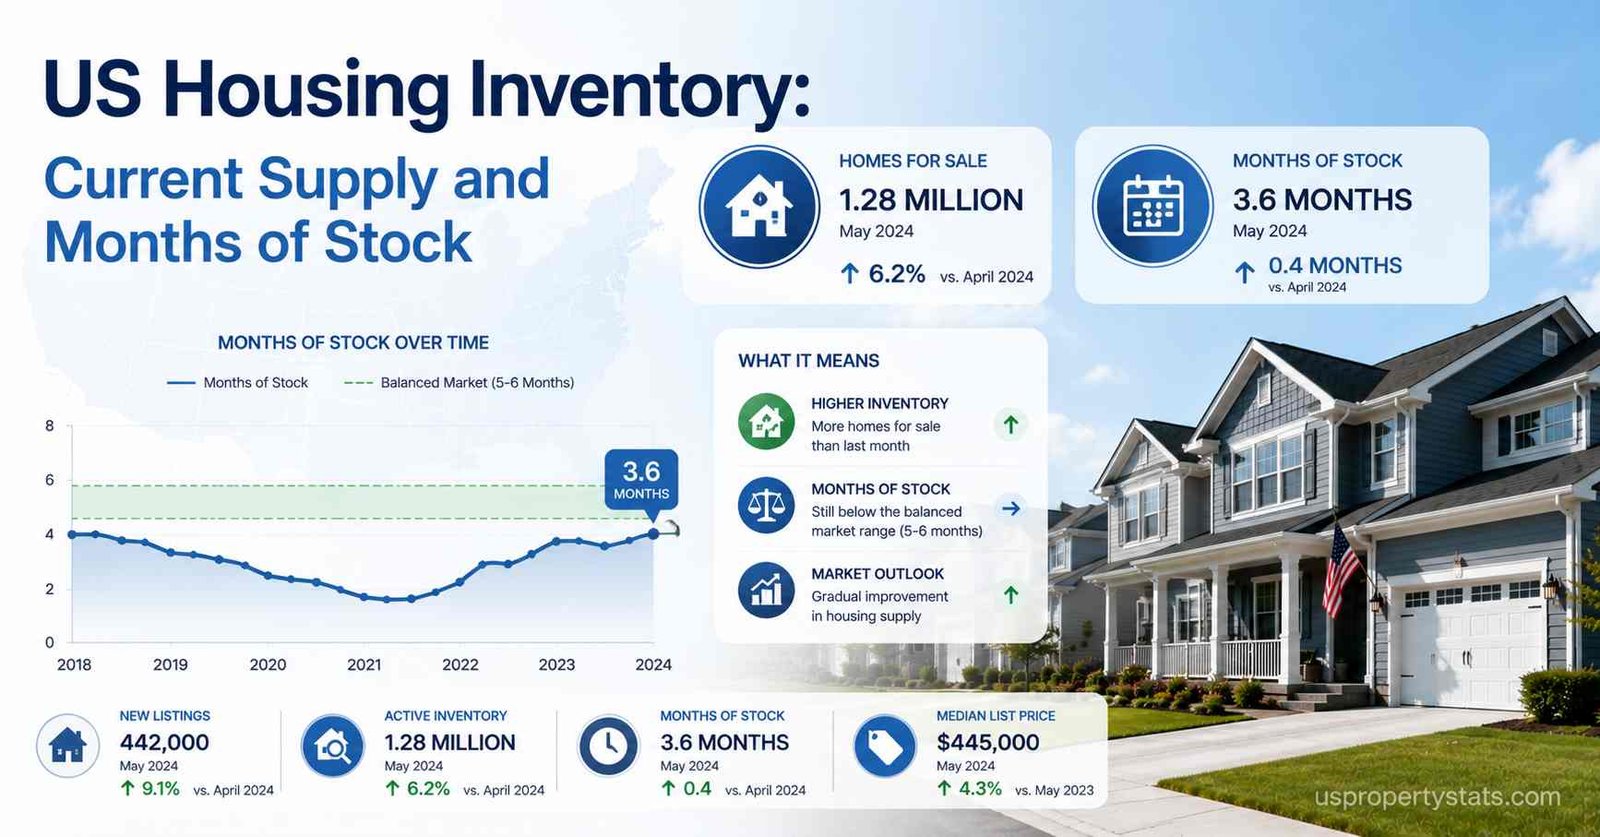
| Existing-Home Active Inventory (NAR) | 1.47 million | April 2026 | +5.8% |
| Months of Supply (NAR) | 4.4 months | April 2026 | +0.1 months |
| Active Listings YoY Growth (Realtor.com) | +4.6% | April 30, 2026 | Was +30.6% one year ago |
| States Above Pre-Pandemic Inventory | 12 of 50 | April 2026 | Up from 9 in February 2026 |
| National Deficit vs Pre-Pandemic | ~-17% to -20% | April 2026 | Improving slowly |
| Pandemic-Era Inventory Low (Feb 2022) | 346,511 listings | February 2022 | -68.5% below Feb 2019 |
| Pre-Pandemic Norm | ~1.85 million | 2017-2019 avg | N/A |
| New-Home Months of Supply | 8.5 months | March 2026 | -0.7 months |
| Estimated US Housing Deficit | 4.7 million units | Zillow, July 2025 | All-time high |
The summary reveals an inventory market in slow recovery from historically extreme lows, not a market approaching balance. The February 2022 low of 346,511 active listings, a -68.5% collapse from pre-pandemic norms, is the most severe inventory contraction in modern housing data. The subsequent four-year rebound has recovered roughly two-thirds of that deficit, but with growth decelerating sharply, reaching pre-pandemic levels nationally is a 2027 or later event.
Monthly Inventory Trend: Active Listings and Months of Supply
| Month | Active Inventory (NAR) | Months of Supply | MoM Change (Inventory) | YoY Change (Inventory) |
|---|---|---|---|---|
| April 2026 | 1,470,000 | 4.4 | +8.1% | +5.8% |
| March 2026 | 1,360,000 | 4.1 | +5.4% | +9.0% |
| February 2026 | 1,290,000 | 3.8 | +9.3% | +8.8% |
| January 2026 | 1,180,000 | 3.5 | N/A | +7.5% |
| December 2025 | 1,150,000 | 3.3 | N/A | +8.5% |
| November 2025 | 1,180,000 | 3.4 | N/A | +17.0% |
| October 2025 | 1,190,000 | 3.6 | N/A | +19.1% |
| September 2025 | 1,350,000 | 4.3 | N/A | +20.9% |
| April 2025 | 1,390,000 | 4.3 | N/A | +20.8% |
| April 2024 | 1,210,000 | 3.5 | N/A | +16.3% |
| Pre-pandemic avg (2017-2019) | ~1,850,000 | ~4.3 | N/A | N/A |
The monthly trend reveals two distinct inventory dynamics. The typical seasonal pattern shows inventory building through spring and summer before declining in fall and winter. That pattern returned in 2025-2026 after being severely disrupted during the pandemic years. April 2026’s 1.47 million is the highest April reading since 2020, recovering ground lost during the 2020-2022 inventory collapse.
The year-over-year growth rate deceleration is the critical trend to watch. In September-October 2025, inventory was growing at +19-21% year-over-year. By April 2026, that rate had compressed to +5.8%. Realtor.com Chief Economist Danielle Hale noted in the January 2026 report: “After meaningful inventory gains last year, the recovery has lost steam. Even with more homes on the market than a year ago, supply remains well below pre-pandemic levels, keeping prices firm nationally.” If the +4-6% YoY growth rate holds through 2026, national inventory will reach approximately 1.55 million by December 2026, still well below the pre-pandemic norm of 1.85 million.
The months of supply reading of 4.4 months requires context. NAR defines a balanced market as 5 to 6 months of supply. Below 5 months favors sellers; above 6 months favors buyers. At 4.4 months, the existing-home market technically remains a seller’s market, though the seller advantage has narrowed substantially from the 1.6-2.5 month readings of 2021-2022. The new-home market at 8.5 months of supply is firmly in buyer’s market territory, explaining why builders are cutting prices and layering incentives.
States Above and Below Pre-Pandemic Inventory Levels
| Category | States | Market Condition | Price Trend |
|---|---|---|---|
| Above pre-pandemic 2019 inventory (12 states) | Alabama, Arizona, Colorado, Florida, Hawaii, Idaho, Nebraska, Nevada, North Carolina, Oklahoma, Oregon, Tennessee, Texas, Utah, Washington | Buyer’s market or balanced | Flat to negative YoY |
| Near pre-pandemic levels (within 10%) | Georgia, South Carolina, Montana, Wyoming, New Mexico, Kansas, Missouri | Approaching balance | Modest appreciation |
| Significantly below pre-pandemic (>20% deficit) | Northeast states (CT, NJ, MA, NY, RI, NH, ME, VT), Midwest (IL, OH, MI, IN, WI, MN), Mid-Atlantic (MD, VA, DE, PA), California | Seller’s market | Above-average appreciation |
The geographic split in inventory conditions explains virtually all of the regional price divergence visible in NAR data. The 12 states where active inventory now exceeds pre-pandemic 2019 levels are predominantly Sun Belt and Mountain West markets: Florida, Texas, Arizona, Colorado, Tennessee, Utah, Idaho, and others. These are the same states that saw the sharpest pandemic-era price run-ups, and elevated inventory is now exerting downward pressure on prices in markets like Cape Coral, Austin, Denver, and Boise.
ResiClub’s April 2026 analysis found that markets where active inventory surpassed pre-pandemic levels “have experienced softer home price growth (or outright price declines) over the past 47 months,” while markets where inventory remains far below 2019 levels “have experienced, relatively speaking, more resilient home price growth.” This is the clearest empirical confirmation that inventory level is the primary driver of local price performance, not national trends.
The Northeast and Midwest represent the inverse case. Connecticut, New Jersey, Massachusetts, New York, Illinois, Ohio, and Michigan remain 25-40% below pre-pandemic inventory levels. Sellers in these markets retain significant pricing power. These states are posting the strongest year-over-year price gains nationally (+4-6%) despite the same elevated mortgage rate environment affecting Sun Belt markets. The difference is entirely supply: when buyers have few options, they compete for what exists rather than walking away.
As of February 2026, ResiClub identified 66 of the nation’s 200 largest housing markets with active inventory above pre-pandemic February 2019 levels. For comparison, in February 2022, not a single one of the 200 largest markets had more inventory than in pre-pandemic 2019. The expansion from 0 to 66 markets over four years quantifies the recovery, but 134 of 200 markets remain supply-constrained. For state-level price data linked to inventory conditions, see Median Home Price in the US and Home Appreciation Rates by State.
The Structural Housing Shortage: How Big Is the Deficit?
| Source | Estimated Shortage | Methodology | Date |
|---|---|---|---|
| Zillow Research | 4.7 million units | Census housing unit data vs household formation | July 2025 |
| NAR | 3.8-5.5 million units | Housing starts vs demand model | 2024 |
| Urban Institute | 3.0-4.0 million units | Affordability-adjusted housing need | 2024 |
| J.P. Morgan | 1.2 million units | Adjusted household formation model | January 2026 |
| Annual new construction (2024) | 1.63 million completions | Census Bureau residential completions | 2024 full year |
| Annual new construction (2026 pace) | ~1.46 million starts | Census Bureau April 2026 SAAR | April 2026 |
The range between the lowest (J.P. Morgan at 1.2 million) and highest (Zillow at 4.7 million) shortage estimates is so wide that it reflects genuine methodological disagreement, not minor measurement differences. J.P. Morgan’s lower estimate adjusts for household formation that they argue was artificially inflated during the pandemic, when low rates and stimulus drove formation rates above sustainable levels. Zillow and NAR use longer-term demand models that capture the decade of underbuilding following the 2008 financial crisis. Both approaches are defensible; the true shortage likely falls somewhere between the two.
What both approaches agree on: current construction rates are insufficient to close the gap. At 1.46 million housing starts annually (April 2026 SAAR), the US is building fewer homes than in 2024, when 1.63 million completions were the highest since 2007. Even at peak recent construction rates, the math does not close quickly. Closing a 3-4 million unit deficit at a 200,000-unit annual surplus above replacement would take 15-20 years. NAHB builder confidence at 37 in May 2026, its 25th consecutive month below 50, signals no acceleration in starts is imminent.
The long-run shortage originated in the decade following the 2008 financial crisis. From 2009 to 2019, the US built significantly fewer homes annually than the roughly 1.5 million needed to keep pace with household formation and replace aging stock. The Urban Institute estimates the cumulative underbuilding from 2012 to 2019 at approximately 5.5 million units. When pandemic-era demand surged in 2020-2021, it collided with a structurally undersupplied market, producing the price surge and inventory collapse seen in 2021-2022.
Why Inventory Remains Constrained: The Lock-In Effect
| Mortgage Rate Bracket | Share of Mortgaged Homeowners | Implied Rate Differential at 6.51% |
|---|---|---|
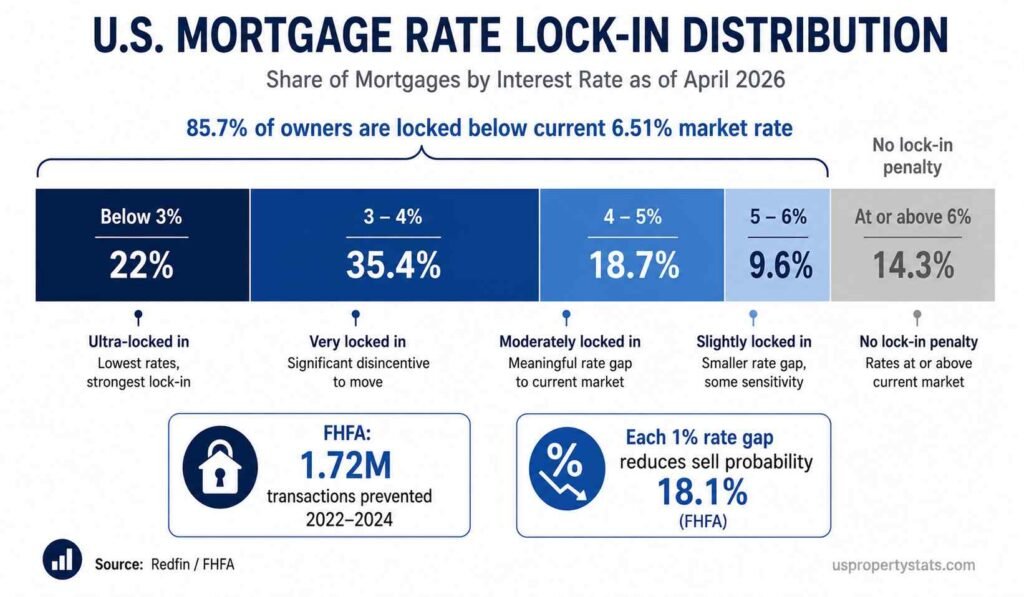
| Below 3% | 22.0% | +3.51 percentage points above current rate |
| 3% to 4% | 35.4% | +2.51 to +3.51 pts above current rate |
| 4% to 5% | 18.7% | +1.51 to +2.51 pts above current rate |
| 5% to 6% | 9.6% | +0.51 to +1.51 pts above current rate |
| Below 6% total | 85.7% | All locked in below current market rate |
| At or above 6% | 14.3% | No financial penalty for selling |
The lock-in effect is the primary reason the inventory recovery has been slower than most forecasters expected. With 85.7% of mortgaged homeowners holding rates below 6%, the financial penalty for selling and buying at the current 6.51% rate is severe for most potential sellers. FHFA research shows each percentage point that market rates exceed a homeowner’s existing rate reduces their probability of selling by 18.1%. A homeowner with a 3% mortgage faces a 3.51-percentage-point differential, implying a 63.5% reduction in their probability of listing compared to a rate-neutral environment.
The lock-in effect prevented an estimated 1.72 million transactions between Q2 2022 and Q2 2024, according to FHFA analysis. Those would-be sellers, who decided not to list because of the rate differential, are the missing inventory. Their homes represent approximately 1.15 years of supply at current sales rates, enough to push the market from undersupplied to balanced if they all listed simultaneously.
The thaw is gradual. Life events including job relocations, divorces, deaths, and family growth force sales regardless of rate differentials, which is why inventory has grown consistently year-over-year since early 2024. The share of sub-3% mortgages edged down from a peak of 24.6% in Q1 2022 to approximately 19.7% in Q4 2025 as loans are paid off, refinanced, or transferred. But with only 14.3% of mortgaged homeowners at or above current market rates, the pool of sellers with no financial lock-in penalty remains small. A sustained move in the 30-year rate below 6% would materially accelerate listings, as the rate differential for the 9.6% of owners in the 5-6% bracket would narrow to under 1 percentage point.
For related data, see US Housing Market Statistics, Home Sales Statistics, and Mortgage Interest Rate History.
Inventory Outlook: When Does the Market Reach Balance?
| Scenario | Rate Trajectory | Inventory Growth Rate | Estimated Balance Point | Probability |
|---|---|---|---|---|
| Bull: Iran ceasefire + Fed cuts | 30-yr drops to 5.5-5.8% by Q4 2026 | +20-30% YoY as lock-in loosens | Late 2026 to early 2027 | Low (15-20%) |
| Base: Rates hold 6.0-6.5% | 30-yr ends 2026 at 6.0-6.3% | +5-10% YoY, slow grind higher | 2028-2029 | High (55-60%) |
| Bear: Rates rise above 7% | Iran escalation, persistent inflation | +2-4% YoY, near stall | 2030 or later | Low-moderate (20-25%) |
The base case for most institutional forecasters is a slow grind toward balance. At the current +4-6% annual inventory growth rate, the existing-home market reaches 1.85 million units (pre-pandemic norm) sometime in 2028. Reaching the 5-6 months of supply range that NAR defines as balanced requires either sustained inventory growth above the current pace or a decline in sales volume (which would raise months of supply mathematically but would not represent market health).
The bull case depends entirely on mortgage rate movement. Fannie Mae’s May 2026 analysis demonstrated that rates reached 5.98% in late February before the Iran War spike. At sub-6% rates, NAR estimates 5.5 million additional households would qualify for the median-priced home. More relevantly for inventory, the FHFA research on the lock-in effect implies that each 50-basis-point decline in rates materially reduces the disincentive for existing homeowners to sell, potentially accelerating new listings.
NAR’s Lawrence Yun has stated that “an additional 300,000 to 500,000 homes for sale would help bring the market closer to normal conditions.” Adding 300,000-500,000 units to current inventory of 1.47 million would push months of supply to approximately 5.7-6.5 months, within the balanced range. At the current annual growth rate of +80,000-90,000 units per year, that threshold is 3.5-5.5 years away in the base case, confirming a 2028-2030 timeline for market balance.
For construction data relevant to the long-run supply outlook, see New Home Construction Statistics and Housing Starts by State. For foreclosure data on distressed inventory, see Foreclosure Statistics: Filings, Rates, and Trends.
Byline: USPropertyStats Editorial Team | Last Updated: May 2026 | Next Update: June 2026 (May NAR data releases June 9)